Full-featured Windows application for the ham operator who wants the lowest-latency LAN path to the shack. Main window unified with the server’s layout (frequency display, VFO A/B, mode picker, a 24-tile memory page across 48 slots, 5 meters, and a transceiver-style control faceplate), all twelve digital decoders, full transmit support including FT8/FT4 with a remote QSO console and image TX (SSTV + WEFAX), SDR panadapter, Lab Measurements RF workstation, dual audio streams, 48 server-synced memories, and a full-screen touch mode for a rugged tablet — all in a single .NET app.
On the LAN the client uses the server’s direct ports for the lowest latency. From outside your home network, switch it to WebSocket mode: everything then rides one authenticated port, the same one the web client and the mobile app use.
💡 Key Features
Dual Audio Streams
Low-latency 12 kHz PCM (~200 ms) for tuning + digital-mode work, plus 192 kbps stereo MP3 HiFi (~1 s) for casual SSB listening. Mutually exclusive; auto-switches to 12 kHz on TX so you hear your own keying without delay.
Listen To Your Own Receiver
With several SDRs on the server, this client picks which one it hears — independently of every other client and of the station’s own audio. By default it follows the station, as before. The server confirms what you actually got, so a refused request never leaves a control disagreeing with your speakers, and a receiver that stops moves you back to the station stream rather than into silence. Recordings are named for the receiver they contain.
Frequency Control
9-digit display with mouse-wheel and arrow-key tuning, VFO A/B, Split, RIT, XIT — all bidirectional with the radio.
Virtual Tuning Knob
Drag-rotate VFO knob with variable step sizes for fine and coarse tuning.
48 Server-Synced Memories
Click to recall, long-press to save, right-click to label or clear. Twelve buttons page across the bank, and All Memories shows every channel at once as a reflowing wall of tiles. Memories live on the server — the desktop, web, mobile, and HA clients all see the same slots and labels in real time.
Twelve Digital Decoders
CW (40+ WPM with WPM scope), RTTY (auto-detect baud + shift, two demod algorithms), PSK31 (9 BPSK/QPSK variants with AFC and FEC), FT8 and FT4 (decoded by the server’s own engine or relayed from WSJT-X — identical from here — with SNR colour-coding, an RX-frequency focus pane and a cycle-locked wide graph that draws a rectangle around every decode), SSTV (20 modes, image + waterfall side-by-side, draggable splitter, popout window, save image, slant/shift correction sliders), WEFAX (weather-fax decoder with phasing-lock detector, IOC 576/288 at 60/120 LPM), NAVTEX (SITOR-B FEC, 100 baud, 170 Hz shift), APRS (AX.25 1200 baud Bell 202 AFSK packet radio), WSPR (propagation spots via WSJT-X, enriched with country, distance and bearing), JS8 (keyboard-to-keyboard traffic bridged from JS8Call), and Olivia / Contestia (a native MFSK decoder — 4 to 64 tones across 125–2000 Hz, no external program needed).
Plug-in Decoders
The server’s drop-in decoder plug-ins appear here automatically, listed after the twelve built-in modes — the client renders a plug-in it has never seen from the manifest the server sends. Select one to view its text or record output (or hear an audio plug-in, such as FreeDV digital voice, on the stream), open a generated Settings dialog for plug-ins that expose parameters, and click-to-tune the ones that declare a centre frequency. Only plug-ins that can run on the console are offered here; per-slot ones run on the server beside everything else. No client-side install — plug-ins live on the server and are shared by every client.
Full Transmit Support
CW, RTTY, PSK31, Olivia / Contestia, APRS, voice, FT8 / FT4, and image modes (SSTV all 19 sub-modes + WEFAX) all driven through the server’s TxEngine. Single-owner lock prevents collisions; chat-style timeline shows incoming RX decodes alongside outgoing TX text. TX:CONFIG protocol broadcasts every TX setting so the client mirrors the server in real time. Test-no-RF mode for offline rehearsal.
FT8 / FT4 Transmit & the Remote QSO Console
Compose FT8 and FT4 from a strip under the decode lists — TX frequency (Shift+click the wide graph to aim it) and a message box that verifies as you type through the transmitter’s own packer, so a message that would pack to something else is refused rather than truncated. Beside it, the server’s QSO sequencer rendered and driveable from here: double-click a decode to name the station, arm Enable TX, and it answers, reports, rogers and offers to log itself, with Tx1–Tx6, Auto-seq and Hold-TX-freq. Arming is exclusive and leashed — one console at a time, and disconnecting releases the arm and halts the sequence, so a dropped link cannot leave a station transmitting unattended. New 2026-10: a contact you drove from here is offered to you for logging when it completes — the Log QSO dialog opens on this client, not on the server’s screen — with the contact’s own times, frequency, mode and the report actually sent. If you have gone, the server asks at the radio instead, so no contact is silently lost.
A Header You Can Rearrange
The control header is a faceplate since 2026-08 — one Operate block (meter column, dial column with its tuning knob, all 19 bands, and the 8 × 3 memory page, all on shared column seams) beside Photo / Spectrum; the connection, audio, recording and tooltip settings moved out to the flight strip’s gear. Drag a block’s grip rail to reorder it, or swap the whole header above or below the tab area from the splitter’s right-click menu or the title-bar Theme → Controls submenu. A block’s width is a function of its own contents, not of where it sits, so reordering never reflows what is inside it.
SDR Panadapter
Embedded scope + waterfall on the SDR tab, with a popout window. Supports multi-SDR — when the server has multiple devices active, a slot selector and Audio button appear to choose which device to view and listen to. Click-to-tune, drag-pan, RF or IF mode (transverter / IF tap). Per-client server-side zoom with navigator overview and rig frequency marker. DX spot and broadcast station markers on the waterfall. Peak markers with configurable style/color/labels. Reverse waterfall, the shared named palettes, phosphor persistence.
Lab Measurements
Professional RF measurement workstation. 8 simultaneous traces with ClearWrite / MaxHold / MinHold / Average / RMS modes, 8 markers with peak search and N-dB bandwidth, DPX persistence display, spectrogram waterfall, automated measurements (channel power, OBW, ACPR, SNR, harmonics, THD, IMD/IP3), two-SDR transfer function (S21) with limit masks, CSV and Touchstone export, and scripts in C# or Python. Tune From Spectrum lets you click a trace to listen on that SDR and click-to-tune the demod listen point without moving the trace, with peak markers and VFO/passband overlays; Band Browse slides across the band by grab-drag or arrow keys. Wheel-zoom at the cursor with zoom history and a Zoom slider; stitch mode splices disjoint SDR bands into one gap-free axis, with a per-trace segment lane editor to keep just the slice of each band you care about. Stitched bands can divide the pane equally or by custom drag-resized splits, zoom one band in place without disturbing the others, and legends can be dragged anywhere on the plot. An Instruments menu adds a modulation analyzer, phase noise, noise figure, a 3-D spectrogram (new 2026-10), plus a view-only mask-trigger event console — the server’s zero-span scope and its six transmitting instruments are server-only, since they need the raw sample stream or a real transmitter. The trace and marker grids dock to any edge; in a side rail the markers grid moves under the traces grid rather than beside it. Full popout support.
Audio Visualization & Recording
Live waterfall / spectrum / oscilloscope / spectrum-LED display in the shared named palettes, peak-hold, gain / contrast / range sliders. MP3 recording with frequency / mode / timestamp filenames.
Multi-Rig Support
Switch between up to 4 rigs — driven by OmniRig, or natively by the server over Icom CI-V or Kenwood CAT. Each maintains independent state; rig-sync rules on the server fire automatically as you move between them.
Touch Mode
New 2026-10. The server’s full-screen touch layout, on the client: RADIO, SPECTRUM, DIGITAL, TRANSMIT and MORE, with glove-sized keys and a hold-to-talk PTT, for running the station remotely from a rugged tablet. See Touch Mode below.
TETRA Panel
New 2026-10. When a server slot decodes a TETRA cell, the TETRA panel shows it here: the cell, its four timeslots, who is calling which group, and the call and short-data logs. Click a timeslot to make that slot play only that timeslot’s voice.
Station Power
New 2026-09. Tools → Station Power shows every switched load with what the load is doing, switches each one, and walks the whole station up or down in order — every press confirmed, every refusal in words, the server deciding everything.
Station Slice
New 2026-08-31. An SDR panel that stays zoomed on the station you are listening to — the passband and a margin — and re-frames itself as the mode, filter or frequency changes, with its resolution stated on the header.
Start Menu
New 2026-10-01. The flight strip’s gear opens a start menu: a tile for everything the client can open, grouped by activity, with search, pins, and the Station Settings blocks as a Settings category.
Band Plan Table
Amateur band allocations with auto-highlight when you tune into a segment. Click any row to QSY instantly.
Custom Colors
Station Settings → App & Appearance → Colors: 23 one-click themes — twenty dark and three light (ShackLink Light, Paper, Blueprint), with scopes, meters and waterfalls that follow a light theme too — plus 60 individual colours, fifteen button finishes, and twenty dial and twenty-three knob styles. A background image can sit behind the window’s own background. Saved between sessions.
User Photo
A multi-purpose panel beside the meters: your shack photo, a live audio visualization, a big tuning knob, the decoder mirror, propagation, the greyline map, or the Station Slice — an SDR view that keeps its own look. New 2026-10: the decoder mirror shows the station’s speech transcript and its translation while speech owns the decoder strip, and Hide photo panel on its menu frees the width on a narrow screen (the Start menu’s Photo Panel tile brings it back).
Tooltips System
Toggle Show Tooltips in Station Settings (the flight strip’s gear) for context-sensitive help on every control. Dark-themed custom draw on separate dialogs.
Tools Tab Popouts
Propagation dashboard (live solar data), the propagation map (day/night terminator, now with a 3-D globe and new layers such as MUF, ionosondes, satellites and the Moon, the same map as the server’s), logbook (ADIF viewer), broadcast guide (searchable EiBi/HFCC/FM/AM/NOAA station database with click-to-tune) — all as detachable popout windows from the Tools tab.
S-Meter & Detachable Meters
S-meter width cap for consistent layout. The meter group (S-meter, SWR, ALC, RF Power, Audio Level) is detachable as a standalone window. Every meter shows live numeric readouts in its corners (reading on one side, dBm/reference on the other), with a toggle back to the legacy centered text.

Main window: the flight strip across the top and the station drawer opened to show the faceplate (frequency readout, VFO A/B, the meters and a page of memories) and the photo panel, with the SDR panadapter tab open below on the 2D waterfall.

The same window with the SDR waterfall toggled to the 3D perspective terrain.
📋 System Requirements
💻 Software
- ✓ Windows 7/8/10/11 (64-bit recommended)
- ✓ .NET Framework 4.7.2 or later
- ✓ Sound card with speakers/headphones
🌐 Network
- ✓ TCP port 8080 (radio control)
- ✓ TCP port 8081 (12 kHz PCM audio)
- ✓ TCP port 8082 (voice TX uplink)
- ✓ TCP port 8084 (HiFi MP3 stream)
- ✓ TCP port 8085 (SDR spectrum)
- ✓ UDP port 8081 (auto-detection)
- ✓ WebSocket mode — single port 8084 with HMAC-SHA-256 auth for internet access
- ✓ LAN (TCP, zero-config) or Internet (WebSocket, authenticated) — user-selectable
🛠 Installation
Download the Client
Download ShackLinkClient.exe from the releases page at ditdots.com
Place in Desired Location
Copy the executable to a folder of your choice. No installation required – it’s portable.
Run the Application
Double-click ShackLinkClient.exe. Windows may ask to allow network access – click Allow.
Configure Server Connection
LAN: The server dropdown automatically discovers all ShackLink servers on the LAN and lists them as HOSTNAME (IP). Pick your server from the dropdown and click Connect. Servers that stop broadcasting disappear after 12 seconds. If auto-detection doesn’t work (firewall blocking UDP), use “Force IP” mode to enter the address manually.
Internet: Click the gear icon, check Use WebSocket, enter the Auth secret from the server’s Station Settings > Security panel, enter the server’s public IP or hostname, and click Connect. This multiplexes everything over a single authenticated connection on port 8084 — the same transport used by the web and mobile clients. Supported exposure methods include a port-forward, Cloudflare Tunnel, Tailscale Funnel, and nginx.
Enable Auto Connect to reconnect automatically after disconnections.
🎮 User Interface
Main Window Layout (server-aligned)
ANT cell outranks even AUDIO. Open the drawer with the STATION ⌄ chevron; it remembers its height and whether you left it open.
And the drawer is now a faceplate. Instead of a grid of groups it is laid out like a transceiver’s front panel — a meter column, a dial column (readout, mode strip, a real tuning knob, control row, readout row), a band column with all 19 bands plus the rig selector and an Audio In picker, and an 8 × 3 memory page so the 48-channel bank is exactly two pages. Connect, Audio and HiFi ride the readout row, because connecting is an operating act on a client the way keying is on a server. Everything settings-shaped moved behind the gear into a Station Settings window. Clicking the meter cycles three faces — bar meters, analog S-meter, cross needle — with the tooltip always naming the next stop, and there is a draggable seam between the faceplate and the photo panel (double-click it to restore the shipped width). Changed 2026-08-24: the faceplate’s duplicate antenna row and its two REC buttons were retired — the antenna now has exactly one picker per window, the flight strip’s
ANT cell, and the record pair became chips on the layout bar.
Most panels below are now dockable: drag a tab to split the window, drag it out for a second monitor, find anything in the panel palette. Dividers are now visibly drawn with a grip — they always worked and always remembered their position, but on the near-black instrument panes there was nothing to aim at.
Rooms. The rail down the left edge carries eight of them — Operate, Survey, Decode, Skim, Transmit, Bench, Log, Station. Clicking one switches: it saves the arrangement you are leaving and restores the one you are arriving at, and it constructs nothing, because browsing activities should be cheap and a panel already on your second monitor must not be disturbed. Assemble room on the layout bar is the separate press that builds the room from its recipe, reclaiming panels out of floating windows first. If the window is too small it degrades by losing regions, not panels: a panel folds into its neighbour as a tab, and if that is still too tight the whole room flattens into one tab group.
The app’s own tabs are never taken away. A freshly built room gives them their own full-width shelf across the top, folded down to the header band and one click from open; the selected header carries a chevron so the fold is visible. A room you arranged yourself keeps whatever you did with the tab pages, and heals on the next Assemble.
The layout bar above the work area carries six painted chips, shedding right-to-left as the window narrows: Ctrl+K Commands, Assemble room, Maximize room / Exit full screen, Reset layout, and the two recorders. Maximize room is full screen for the whole work area — it sheds the station drawer and touches no panel arrangement, so every panel grows, and the rail deliberately stays so rooms remain reachable from inside it. Reset layout clears all eight rooms and closes every float, so it asks first. A chip that is recording never sheds, but it never moves either: a chip’s position may not depend on its own state, only whether it survives may.
The pickers you touch while operating are grids, not lists. The flight strip’s five clickable cells and the faceplate’s four combo boxes open a grid of button tiles. Nothing moved and nothing was replaced — the combo still owns the value and a pick runs exactly the action the old menu entry ran — but every tile’s label is drawn at the same size, computed from the widest caption, and a refused entry is greyed and still visible rather than hidden. The antenna picker is a panel of cards.
The main window is laid out to mirror the server’s main window pixel-for-pixel where the controls have a 1:1 analog. Clicking around the desktop client and the server feels identical — same frequency display, same memory grid, same VFO A/B box, same Split / RIT / XIT row, same callsign label, same 5-meter rack on the right.
- Left region — the VFO frequency readout, a vertical 19-segment band strip, a horizontal mode strip, the memory-preset row (page navigation, VFO A/B, Log and direct-entry buttons) and the memory page (8 × 3 tiles, so the 48-channel bank is two pages).
- Below left —
grpSplitRitXit: Split / RIT / XIT toggles, VFO-B display, RIT offset. - Center top — status labels, Connect button, Auto Connect, rig selector.
- Center mid (client-only) — Server IP, Port, Config gear (the band the server uses for its audio device list).
- Center mid — volume meter + slider.
- Center lower — Audio button, HiFi button (with status label), Record button, recording duration, recording path + Browse.
- Right region — the callsign strip (
CallsignClockDisplay, shared with the server) showing the operator callsign plus an NTP-synced UTC clock with configurable layout / font / colors, andgrpMeterswith all 5 RadioMeter controls: S-meter, SWR, ALC, RF Power, Audio Level. Server already broadcasts SWR / ALC / RFPOWER inRIG:n:SMETER:...;SWR:...;ALC:...;RFPOWER:...;AUDIOLEVEL:....
Tabs
The work area below the unified control surface has these tabs (in order): Audio, Decoder, TX, Band Plan, SDR, Lab, Log, Tools. The Tools tab provides launcher tiles for the popout windows (listed under Tools Tab & Themes below); Colors and the Tooltips toggle live in Station Settings. The active tab is persisted between sessions by name (resilient to re-orders in future builds). The Log tab’s QSO dialog captures State and Country alongside the usual fields, with a manual Lookup button to fetch callsign data on demand.
Title Bar
The window title bar carries two extras shared with the server:
- NTP UTC clock — the same NTP-synced UTC time shown on the callsign strip also appears in the window title.
- Theme submenu — the title-bar (window) system menu has a Theme submenu for picking a color theme straight from the window’s system menu, in addition to the full Colors dialog in Station Settings.
Connection Area
| Control | Description |
|---|---|
| Server | Dropdown listing all discovered ShackLink servers as HOSTNAME (IP). Servers are discovered via UDP broadcast on port 8081; entries disappear 12 seconds after the server stops broadcasting. Select a server to auto-fill the IP and port. |
| Port | Control port (default: 8080). Audio (8081), voice TX (8082), HiFi (8084), and SDR (8085) are derived automatically. |
| Config (gear icon) | Opens settings dialog for advanced options |
| Connect | Connect/disconnect from server. Shows current connection status. |
| Audio | Start/stop the low-latency 12 kHz PCM stream (~200 ms). Use this for tuning, CW/RTTY/PSK decoding, and hearing your own TX in real time. State is remembered between sessions. |
| HiFi | Start/stop the 192 kbps stereo MP3 stream (~1 s latency). Use this for broadcast-quality listening / SSB voice QSOs. Mutually exclusive with Audio — starting one stops the other. State is remembered between sessions. Auto-switches to 12 kHz on TX because the MP3 buffer is too long for hearing your own keying; stays on 12 kHz until you click HiFi again. |
| Auto Connect | Automatically connect when application starts |
| Audio Auto-Start | Whichever audio path (Audio / HiFi) was active last session auto-starts when you reconnect |
Frequency Readout
The frequency lives on a single VFO readout control from the shared Freq-Dial library — a header row (which VFO or SDR slot you are looking at, plus band and mode), the nine digits grouped MHz / kHz / Hz with a unit legend, and a footer showing the current step size. Sixteen visual styles are available (transflective LCD with unlit ghost segments, vacuum fluorescent, amber LED, Nixie, dot-matrix, split-flap, brushed metal and more), and it can either wear its own palette or follow your app theme.
Tuning Methods:
- Mouse wheel on a digit – Steps that digit, and selects it
- Click to select – Click a digit to make it the tuning step for the knob (click it again to unlatch). Hovering alone no longer changes the step
- Drag a digit – Vertical drag steps continuously
- Type it –
14074000and14.074both mean 14.074 MHz; Enter commits, Esc cancels - Arrow keys – ←/→ move the selection, ↑/↓ step it
- RND (new 2026-10) – a badge on the readout rounds the frequency to the nearest 100 Hz in one click; it is lit only when there is something to round. The VFO windows have it too
Virtual Tuning Knob
Tuning uses the shared Freq-Knob library — a SkiaSharp rotary-knob renderer (one engine, 19 styles) also used on the server. The FrequencyKnob is an endless VFO dial with per-digit step sizes and flywheel momentum:
- Click and drag – Rotate the knob to change frequency; a quick flick spins the flywheel and coasts to a stop
- Clockwise increases frequency, counter-clockwise decreases it
- Step size – Determined by the selected digit in the frequency display (per-digit stepping)
- Resizeable frequency popup – The pop-up frequency window is resizeable and hosts the rotary knob for large-dial tuning
- Photo-panel “Knob” mode – The operator photo panel has a third right-click mode that turns it into a live tuning knob (shared with the server’s photo panel;
PhotoShowKnob/PhotoKnobState)
Tools Tab & Themes
The Tools tab collects detachable popout launchers — Propagation, Greyline Map, Logbook, Broadcast Guide, Band Activity, Spectrum Snapshots, Lab, Band Skimmer, Wide Scan, FT8 Wideband, Slot Decoders, VFO Windows, Station Slice, Station Power, TETRA, and the Decoder / TX / Visualization / SDR Waterfall / Band Plan / Log windows. (The Winlink mail window was removed in 2026-10: Winlink is operated at the station.) Every one of them is also a tile in the start menu behind the flight strip’s gear (new 2026-10-01), which adds search, pins and a Settings category with a tile per Station Settings block. The Colors dialog, Show Tooltips, Tools panels open as windows and Background Image live in Station Settings → App & Appearance. A color theme can be applied from there or from the window’s system menu; it retints the entire UI (frequency readout, meters, panels, and controls) and persists between sessions.
Since every button, dropdown, list and tab header is drawn by the client itself rather than by Windows, the Colors dialog also carries a global Button Finish (Glossy Grooved / Glossy Smooth / Matte Panel LED / Satin Panel LED / Flat Fill), a text-glow toggle, and the VFO Dial style picker — plus two size controls: Text Size for the text the client draws (waterfall labels, meter faces, Lab readouts) and Button Text, which sets how much of a button’s height its label takes without changing the button’s size or layout. The finish is the material and the theme is the colour: changing one never changes the other. Twenty-three themes ship built in, including Dark Panel — a charcoal body with amber buttons, for the classic radio-panel look — and, since 2026-09-14, three light themes (ShackLink Light, Paper, Blueprint) under which the scopes, meters, VFO readout and waterfalls go light too, each with a switch to keep it dark.
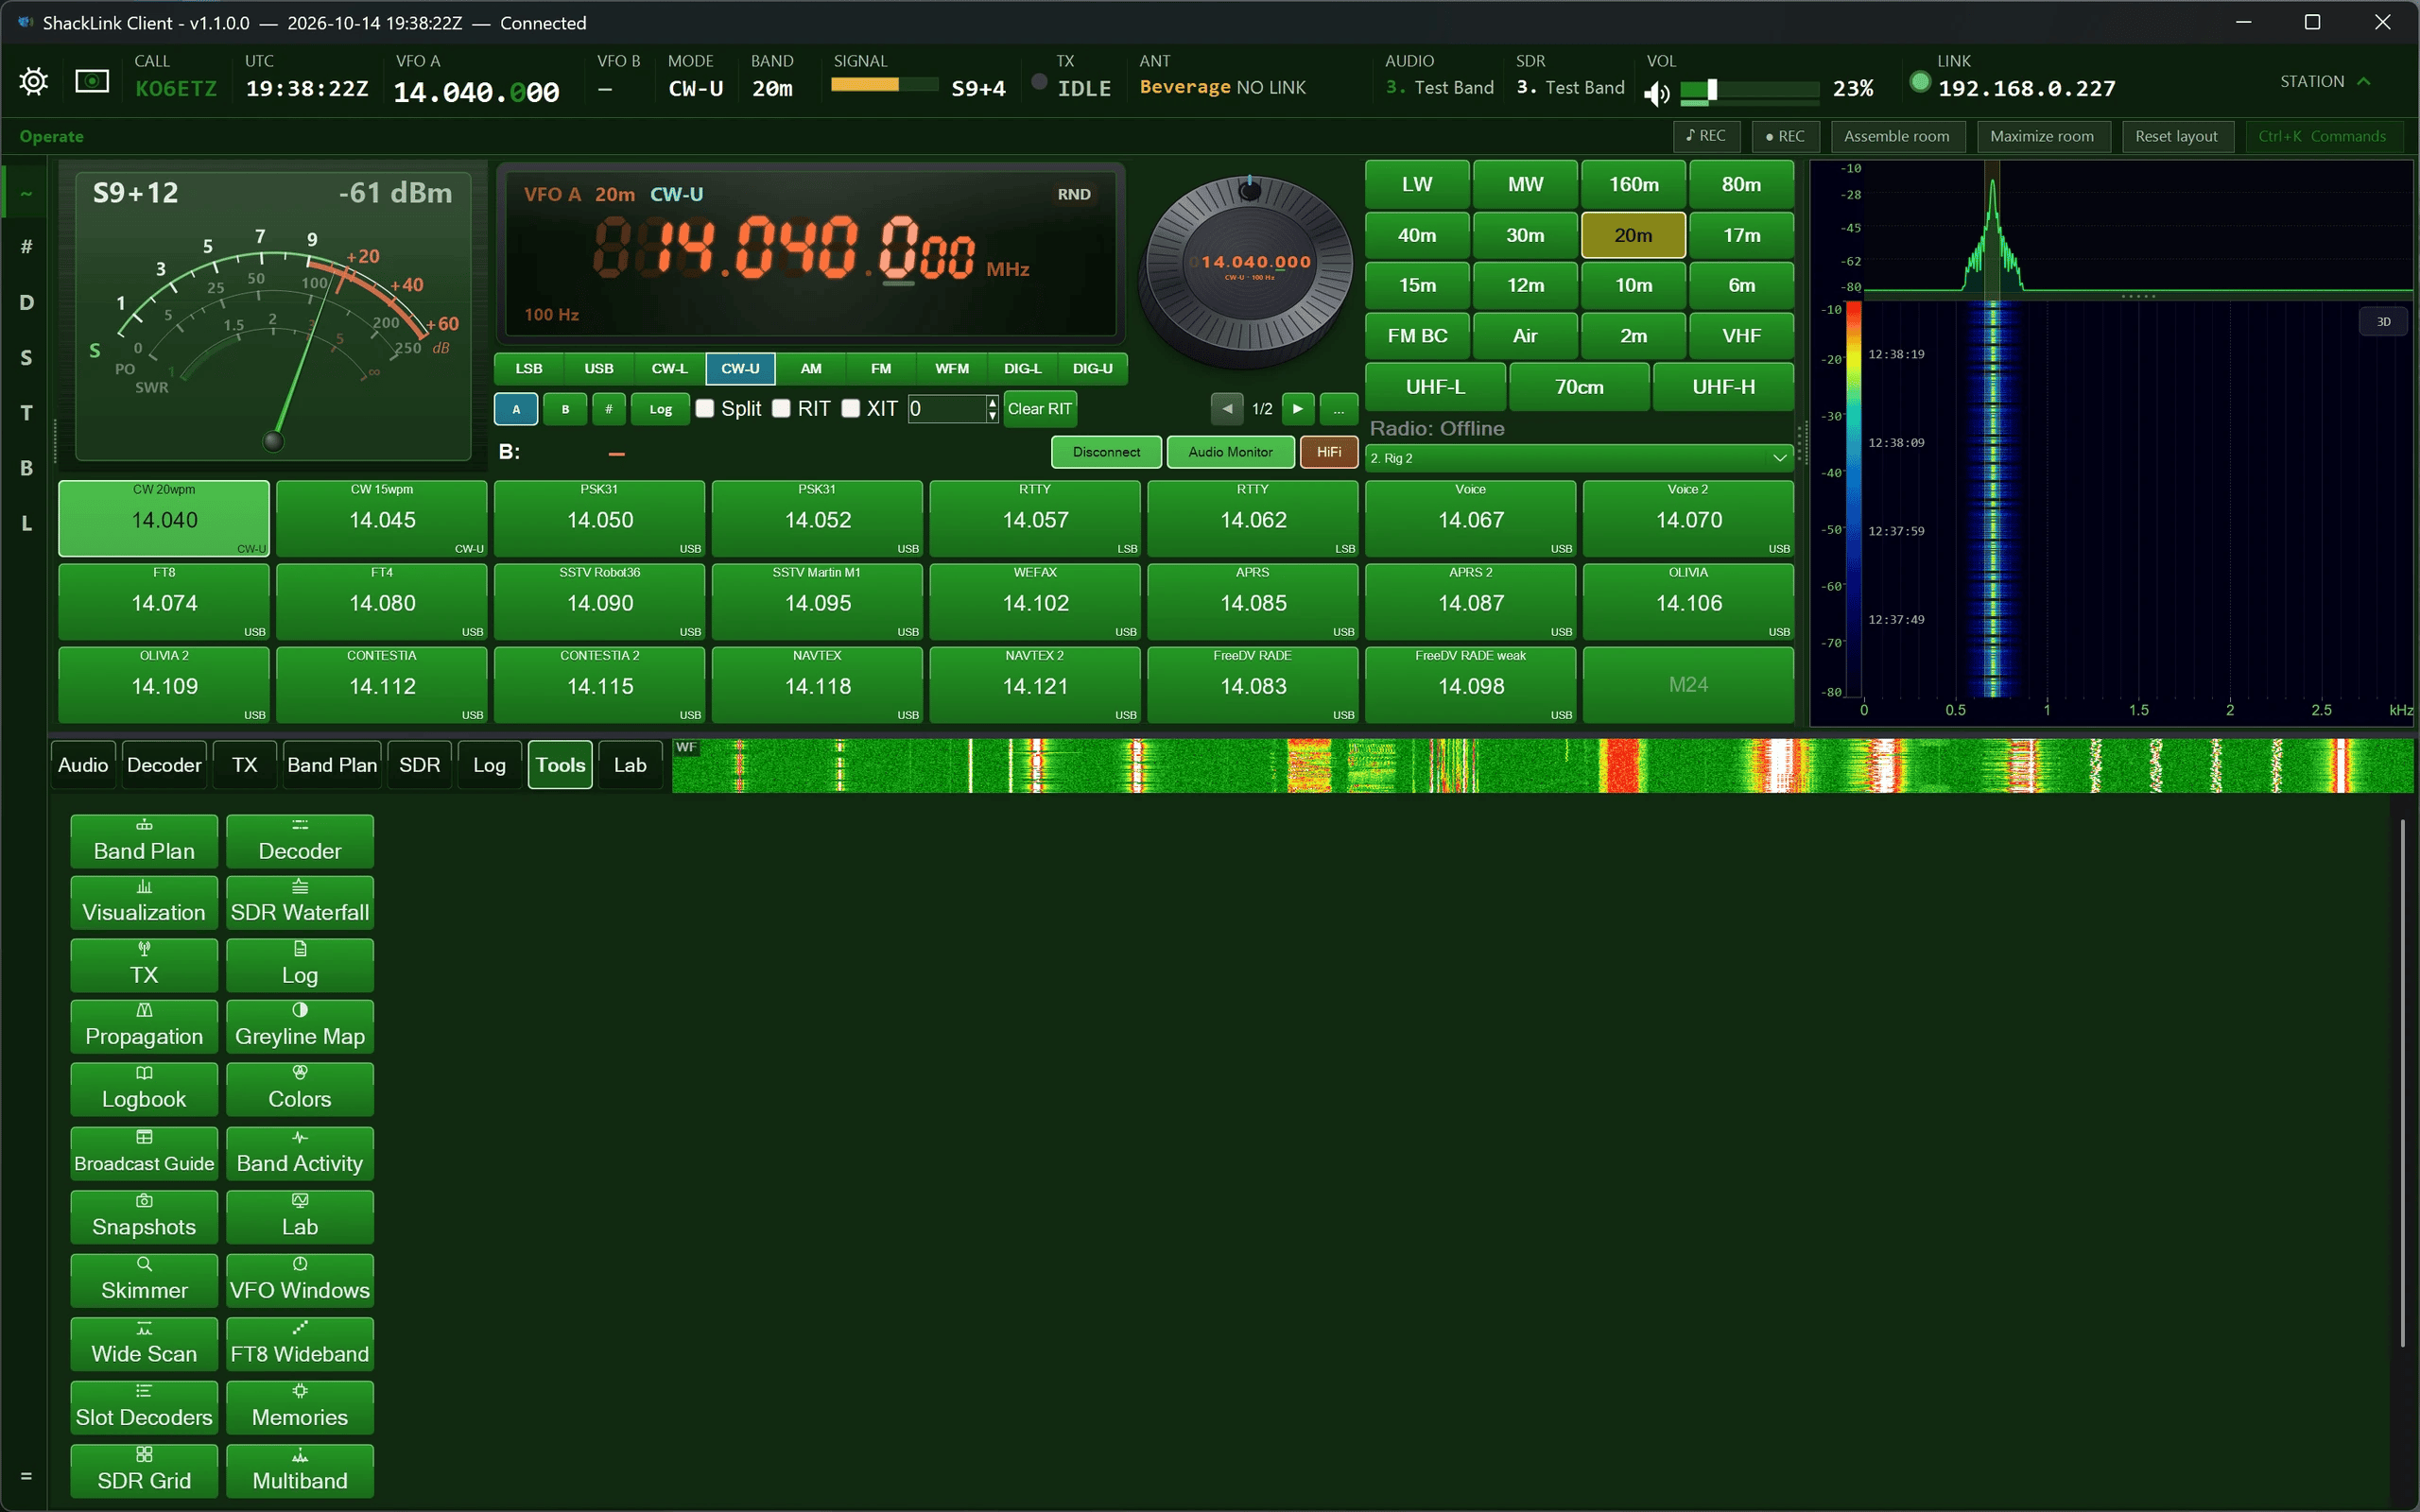
The Tools tab popout grid, shown with the Classic Green theme applied across the whole client.
☝️ Touch Mode
New 2026-10. The client carries the server’s full-screen touch mode, built for a 12-inch rugged tablet such as a Panasonic Toughbook, so the station can be run remotely from glass. Tap the touch cell on the flight strip, pick Touch Mode in the Start menu, or press Ctrl+K and type “touch”; the big DESKTOP key comes back to the normal window. Every key is at least 12 mm on the glass, and a key only acts when your finger is the only thing touching the screen, so a resting palm cannot press anything. All five pages are here:
- RADIO: the large frequency, DOWN / UP, the keypad and the twelve soft keys. LISTENING TO picks the receiver this client hears, or STATION to follow the station’s own audio. The filter, AGC, noise blanker, noise reduction, notch, squelch and NR-level keys change that receiver’s settings on the server, so everyone listening to that receiver hears the change; on the radio’s own audio, filter, AGC and squelch are the radio’s front panel and are refused in words.
- SPECTRUM: the panadapter, with tap-to-tune, zoom keys and FOLLOW TUNING.
- DIGITAL: the decoders and the FT8 / FT4 QSO console, driven as this client, with the LOG IT / EDIT / DON’T LOG card for contacts you drove.
- TRANSMIT: the hold-to-talk PTT over the network, the transmit mode, the power in the station’s own unit, your macros, CW speed and STOP. If the station refuses the key-up, the PTT says NOT KEYED and why, a moment later. TX monitor is the station’s speaker, so the key says AT THE STATION.
- MORE: the client’s Start menu on finger-sized keys.
The full description of the pages is on the server page.
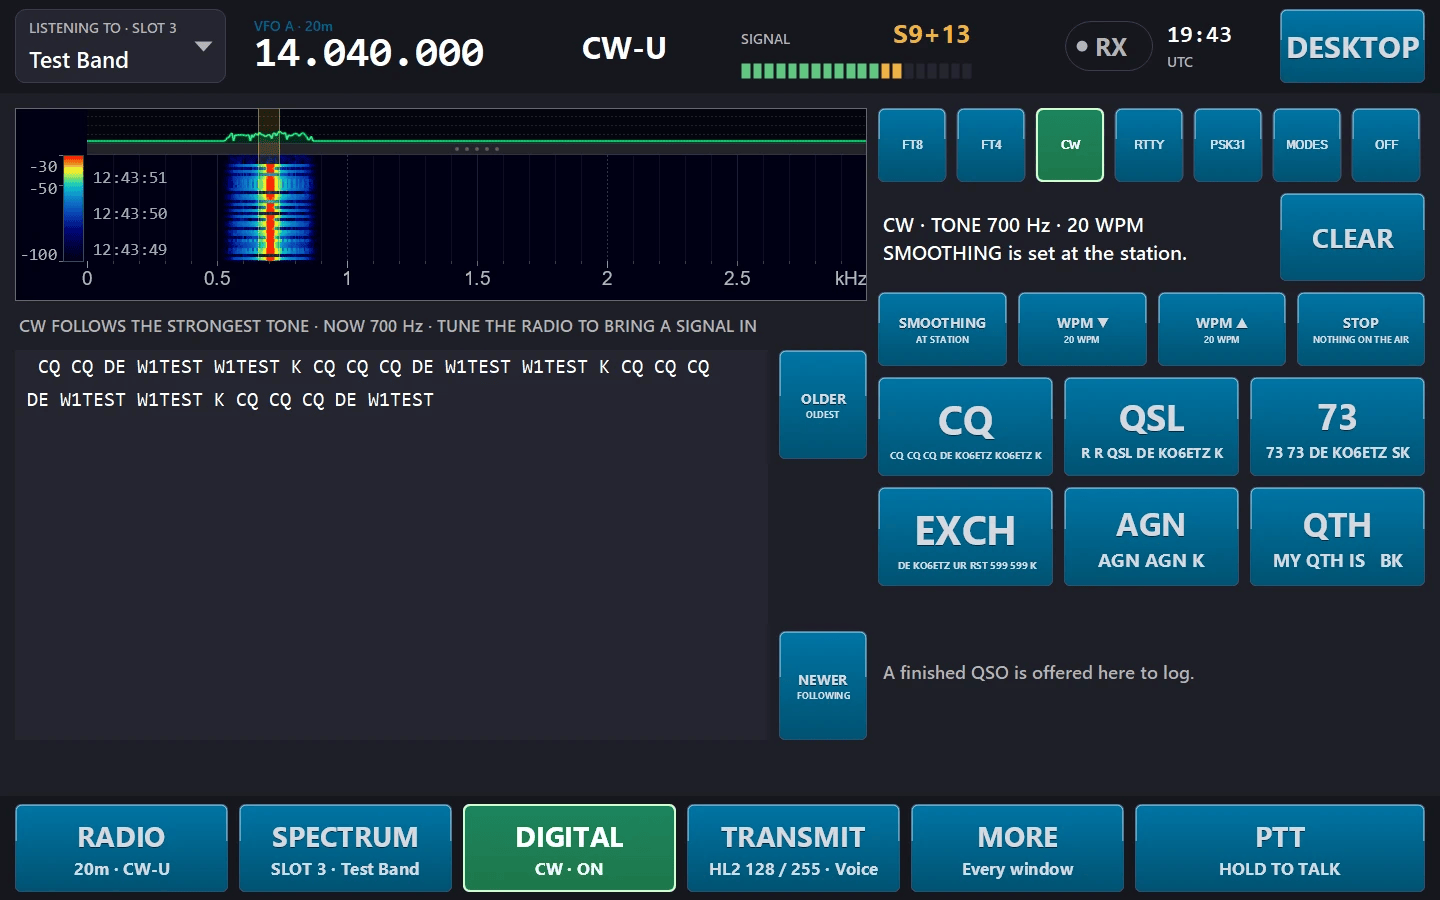
The DIGITAL page on the client: the station’s decoder on glass — CW here, with the decoded text and the macro keys
💾 Memory & Modes
Memory Buttons
48 programmable memory slots synced with the server in real-time:
- Quick click – Recall saved frequency and mode
- Long press (1 second) – Save current frequency and mode to that slot
- Right-click – Clear a programmed slot
- Labels – Custom labels can be assigned via the “All Memory Slots” dialog
- Active memory – Highlighted when current frequency and mode match
- All Memory Slots – Click the “All Memories” button for a scrollable grid with inline label editing
Memory contents are stored on the server and synchronized with all connected clients. Changes from any client (desktop, web, mobile, or HA) appear on all others instantly.
Audio Tab — Visualization & Recording
The Audio tab renders the received audio as a live waterfall / spectrum / oscilloscope / spectrum-LED display in the shared named palettes, with peak-hold and gain / contrast / range sliders. When the stream is stereo (HiFi MP3 or WFM), the display splits into dual L/R channels. Since 2026-09-03 the pickers and sliders live on the display’s right-click menu (the CTL chip in the waterfall’s corner brings the slider strip back on screen), and the waterfall carries the SDR display’s dB legend and a draggable spectrum/waterfall divider. The screenshots below predate that.
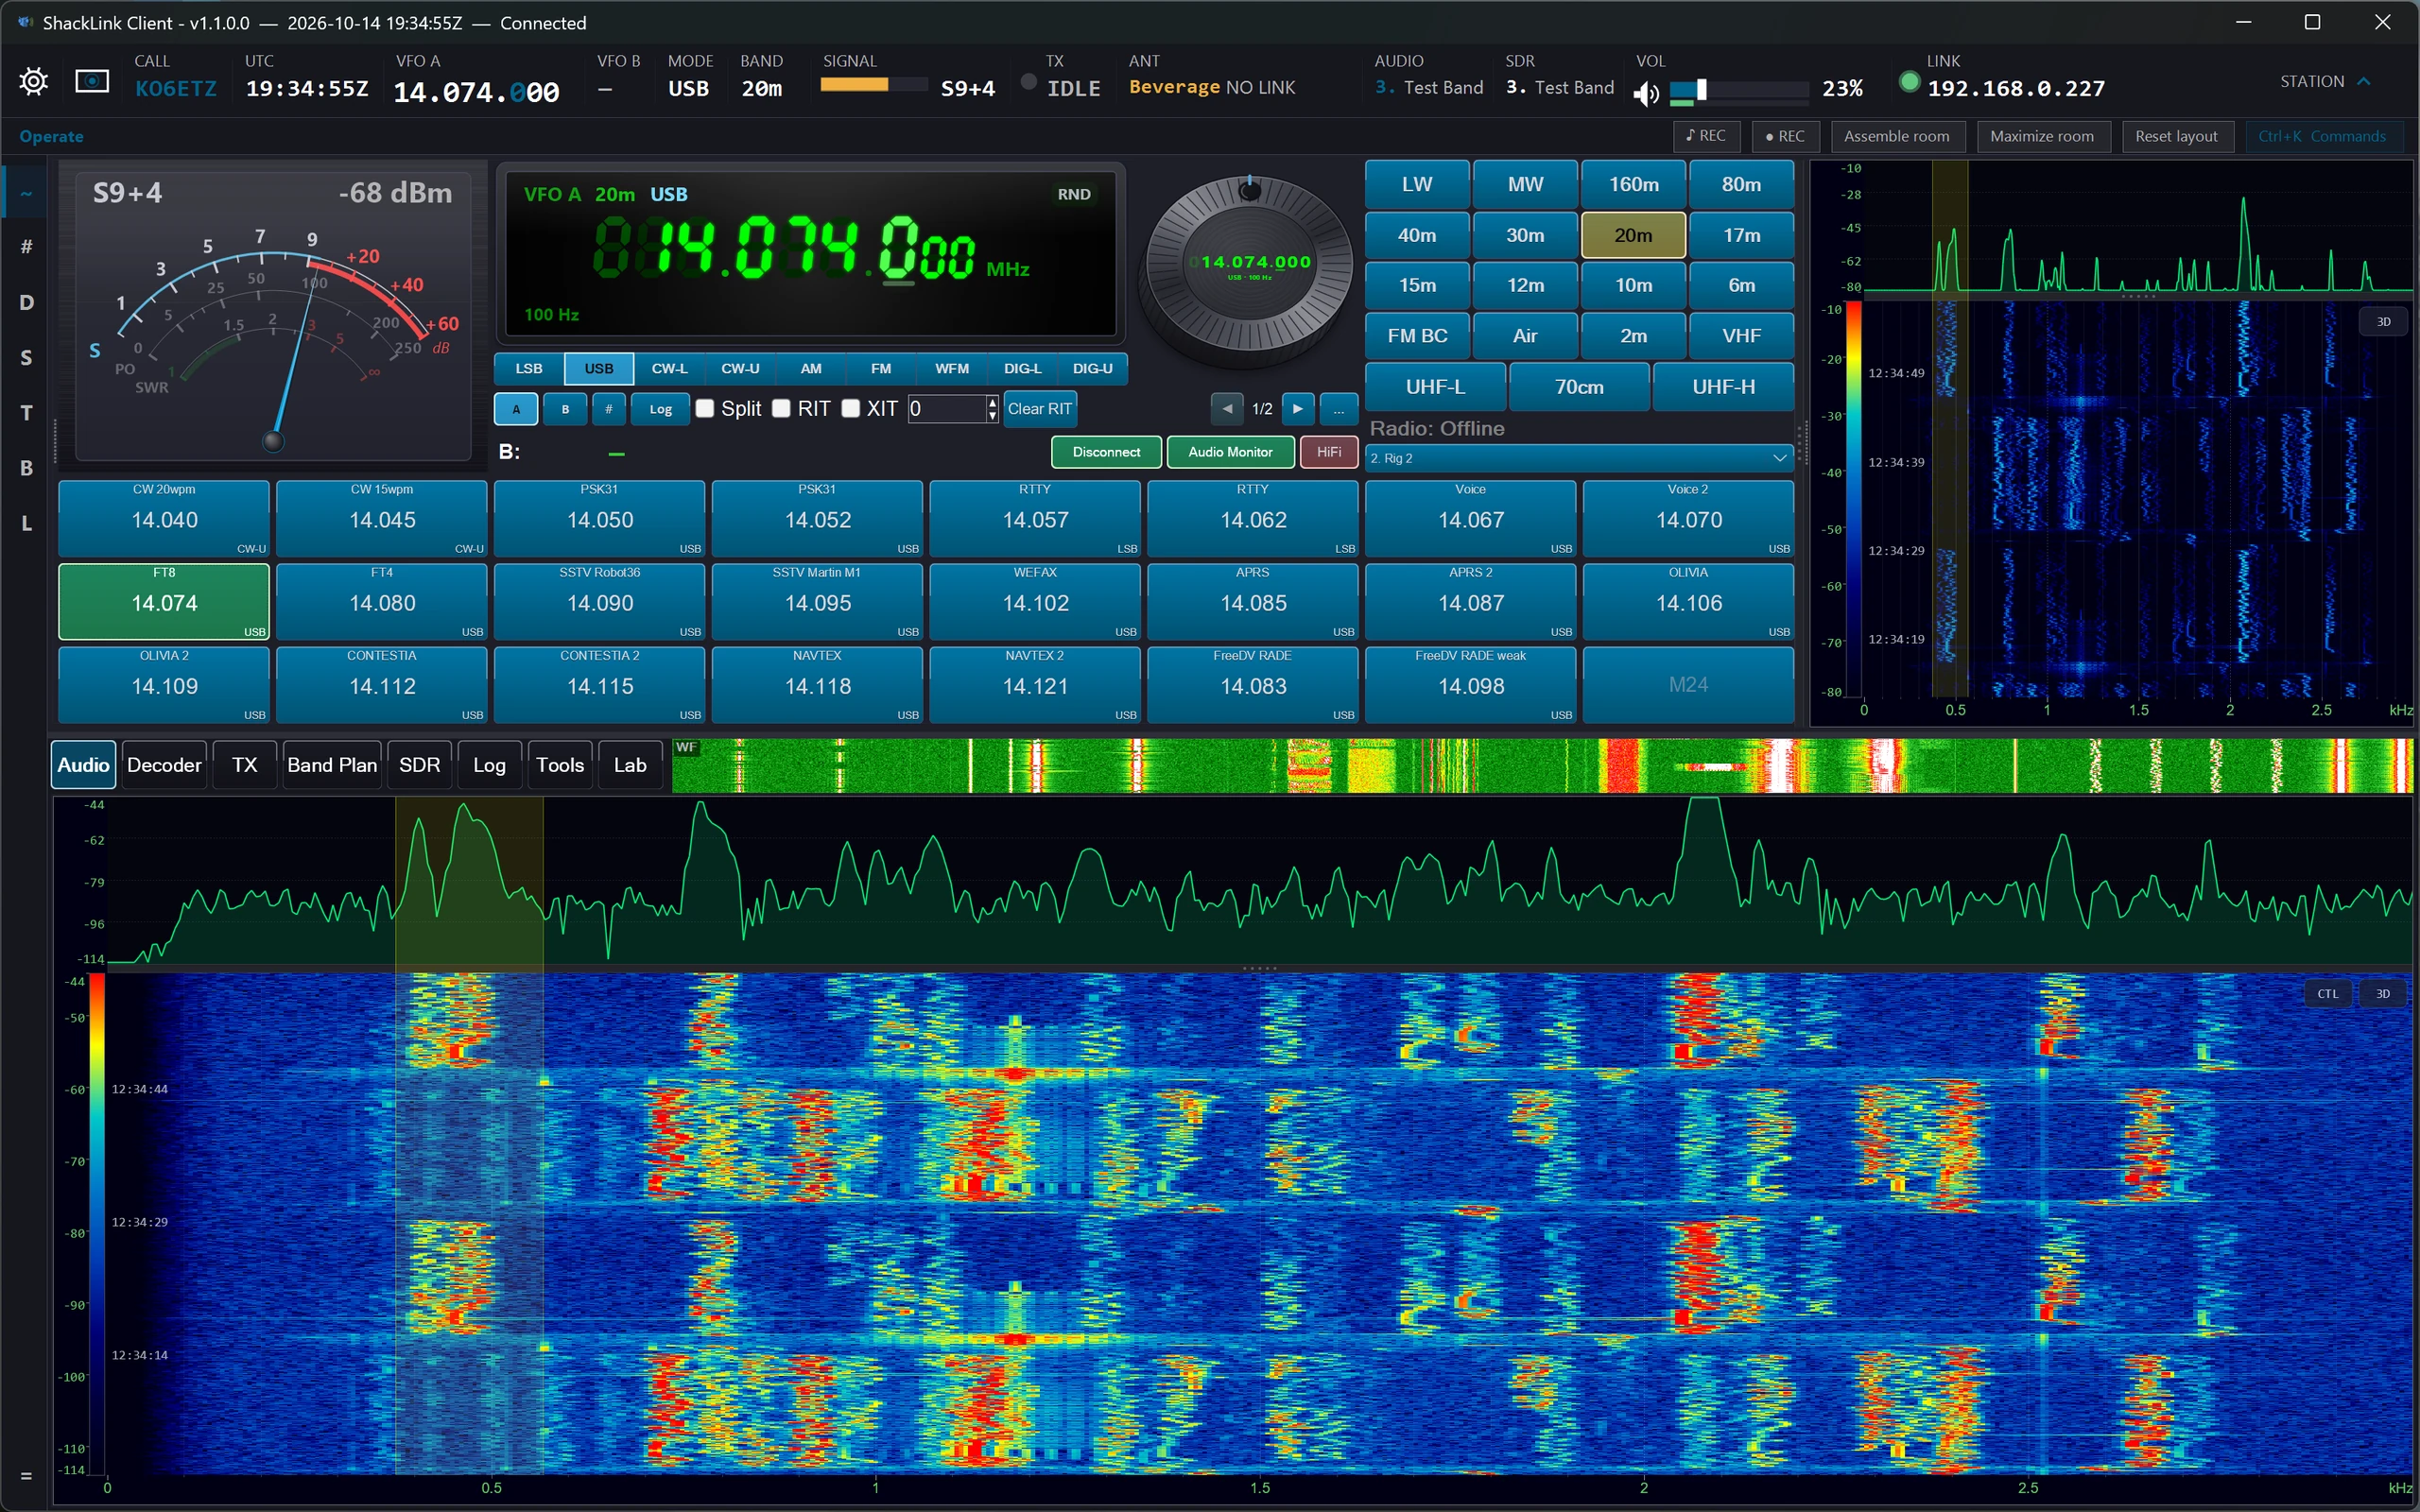
Dual-channel (stereo) spectrum and 2D waterfall of the received audio, with mode / theme pickers and gain, contrast, and range sliders.
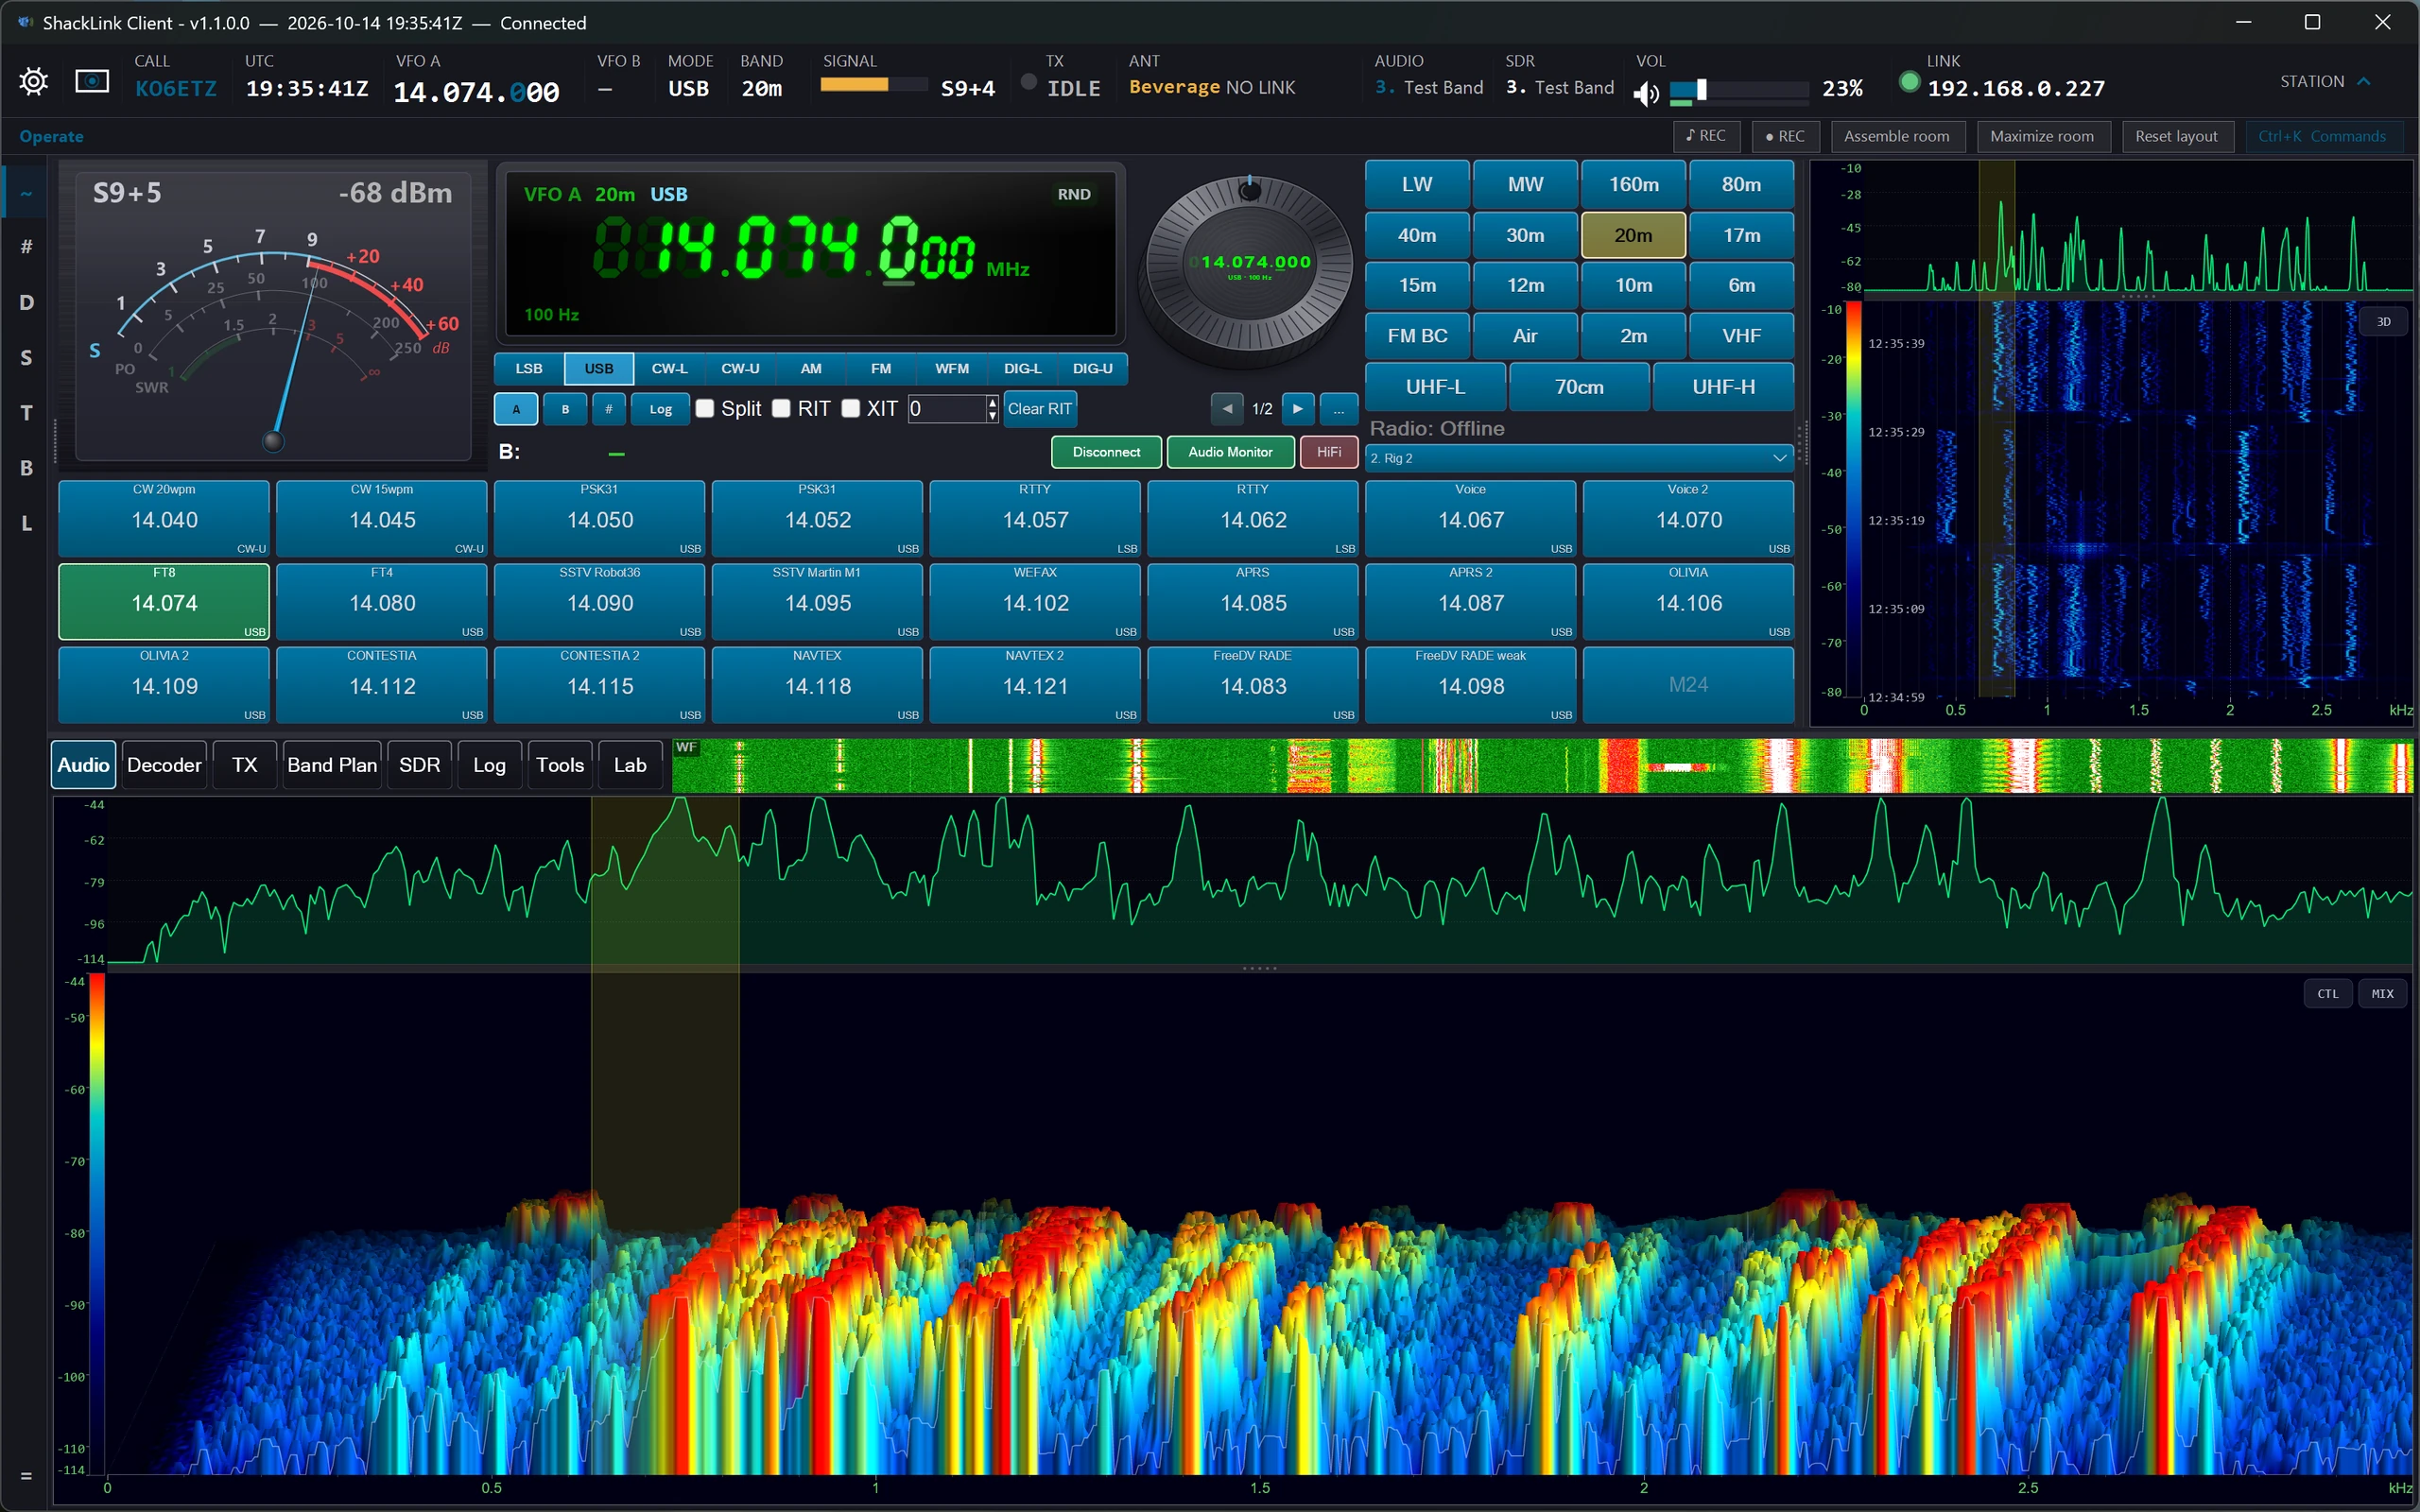
The same visualization toggled to the 3D perspective terrain waterfall (both stereo channels).
Audio Waterfall Tuning
The audio waterfall is the primary way to place a decoder on a signal. It behaves identically on all three surfaces that host it — the Audio tab, the photo panel, and the Visualization popout:
- Hover — a dim ghost cursor follows the pointer, reading out the frequency under it, and — for modes you can retune — a preview of the decoder’s passband centred on the cursor, so you can see how it would sit on the signal before you commit. Nothing is committed until you click.
- Click to place — the decoder moves there. The marker then shows where the decoder actually landed, so if the value was out of range you see the clamp rather than a marker that quietly disagrees. Only PSK31, Olivia and NAVTEX have a centre frequency to move; in other modes the click just parks the marker.
- Decoder passband — a translucent rectangle showing the span the active decoder is listening across: Olivia’s exact bandwidth (16/500 = 500 Hz), PSK31’s symbol rate, RTTY’s live auto-detected mark/space rails, and the fixed tone rails for NAVTEX, APRS, SSTV, WEFAX and CW. It is the nominal occupied span — an alignment aid, not a measured bandwidth. Right-click → Decoder Passband toggles it.
- Nothing drawn for the bridged modes — FT8, WSPR and JS8 show no passband: those are decoded by WSJT-X / JS8Call, not by ShackLink, so there is nothing honest to draw.
This is distinct from the SDR panadapter’s click-to-tune below: clicking the audio waterfall sets the decoder’s centre frequency, while clicking the SDR waterfall moves the rig.
SDR Panadapter
The SDR tab connects to the server’s spectrum stream for real-time waterfall and spectrum display:
- Multi-SDR slot selector – When the server has multiple SDR devices active (up to 8), a Slot dropdown and Audio button appear. Select a slot to view its spectrum; press Audio to switch the listening source. Hidden when only one device is active.
- Slot kinds – Some slots are not frequency-agile the way a normal SDR is: a native Icom CI-V scope slot and an IQ-file playback slot (a looped recording) have a fixed LO, so drag-to-pan — and, for Icom, the FFT-size and Zoom-FFT controls — are disabled, and click-to-tune moves the demodulator listen point instead of re-centering the capture. (IQ-file slots keep the FFT size adjustable.)
- Web receiver slots (new 2026-08) – A server slot can be a public web receiver on the internet — a KiwiSDR, a Web-888 or a SpyServer — rather than a radio attached to the server. It streams here like any other slot; the difference is that a Kiwi channel is only a few tens of kHz wide, so click-to-tune moves the remote receiver’s passband rather than a local LO. If the server has the slot’s full-band overview switched on, this window prefers the receiver’s own whole-band picture on the navigator strip while it is arriving — which is why the navigator on such a slot is far wider than the waterfall under it — and falls back to the ordinary derived strip if it stops. Which receivers to use is chosen on the server, where the connection is held.
- More slot kinds (new 2026-08/09) – OpenWebRX receivers (the receiver demodulates; the Multiband mode strip offers that receiver’s modes, including the digital-voice modes DMR, D-STAR, YSF, NXDN, P25, M17 and TETRA, and the Slot Decoders console shows who is talking), SoapySDR radios, and USRP / PlutoSDR-class boards, which appear as a radio slot plus narrow sub-receivers. A slot with a converter, transverter or LNB in front of it arrives here already in real RF frequencies.
- Station Slice (new 2026-08-31) – Tools → Station Slice: a panel that stays zoomed on the station you are listening to, re-framing itself as the mode, filter or frequency changes, with the slice’s resolution on its header
- Embedded display – Scope + waterfall on the SDR tab
- Popout window – Separate resizable window via “Popout Spectrum” button
- Click-to-tune – Click on the waterfall to change the rig frequency (routed to the selected slot)
- Memory markers – Optional frequency markers from stored memories
- DX spot markers – Live DX cluster spots drawn on the waterfall with callsign labels
- Broadcast station markers – Known broadcast station frequencies overlaid with station name labels
- Auto-Identify chips – When the server’s AI signal-recognition scan is running, the desktop client shows the same colour-coded mode chips over each identified signal (CW, RTTY, PSK, FT8, SSTV/WEFAX, APRS, voice, …). Hover a chip for the top candidate modes, confidence, and measured bandwidth / SNR; a right-click Show Signal Labels toggle hides them locally.
- RDS chip – Whenever the SDR demodulator is in WFM, RDS decoding auto-activates — it is not a decode mode you select. It decodes the 57 kHz subcarrier and shows a teal RDS <station name> chip at the tuning marker (dim until sync), in the same chip idiom as Auto-Identify. The hover card carries the full detail: programme identification (PI), programme type, RadioText, clock time, ECC / language, and traffic / network data (TMC / EON). It appears on the embedded SDR tab, the slot popouts, and the grid cells.
- Navigator overview – Miniature full-band view showing the current zoom window position with rig frequency line
- Peak markers – Configurable markers on the strongest spectrum peaks (count, color, size, style, frequency labels)
- Reverse waterfall – Flipped layout with upward scrolling (waterfall on top, scope on bottom)
- Palette – 13 waterfall gradients (two of them light) and 12 spectrum ones, two name-keyed sets unified with the Lab tab, Multiband, the mobile app and the browser: Classic (blue), Classic (green), CoolWarm, Viridis, Plasma, Inferno, Grayscale, Neon (cyan), Signal (teal), Semaphore, Rainbow, Paper (light), Blueprint (light). Both are picked from a grid of little rendered waterfalls rather than a list of names, and every tile renders the same synthetic frame so the tiles differ only in the palette. The spectrum set opens with a Solid (single colour) sentinel — the single-hue trace the SDR has always drawn, using the Fill and Line colours set below it
- Waterfall view — three modes, not two – flat 2D, a full-pane 3D perspective terrain, and Split, which puts the terrain on the top half and the flat scroll underneath, joined on one shared instant: both show now at the seam, and history runs away from it in both directions. Right-click → Waterfall View, or the corner button; remembered per slot. Drag to orbit in the full-pane view (right-drag pans vertically); in the Split the camera is fixed so the two halves can meet, and the drag becomes an oblique lean instead. Parallel projection is now the default for the full-pane view too, with the orbit camera one click away — under perspective only the centre column runs straight up the screen, so edge ridges lean opposite ways, which reads as depth on its own and as a fault line the moment a flat waterfall sits underneath. GPU-accelerated (SkiaSharp / OpenGL) with a CPU fallback that says so on a badge; colours and heights match the 2D waterfall exactly
- Waterfall Ref (max-level) slider – Sets the top of the waterfall color scale (dBFS) so strong signals reach the top (“red”) of the palette instead of being clipped below full scale
- Phosphor histogram mode – An optional, experimental GQRX-style histogram / density spectrum color mode alongside the existing amplitude-hue, density-palette, and Gaussian-spread phosphor modes
- Background picture (new 2026-09-03) – right-click → Background Picture puts an image behind the spectrum, with the waterfall fading as the picture strengthens
- CTL chip (new 2026-09-04) – beside the 2D/3D button; shows and hides the pane’s Gain / Contrast / Floor / Ref / Zoom strip
- Zoom FFT per slot (2026-09-28) – offered on every slot whose device has it, and a pop-out’s zoom applies to that window’s own slot
- Auto-discovery – SDR stream port discovered via UDP broadcast

The phosphor / persistence spectrum: signal density is color-mapped instead of a single trace line, over the 2D waterfall. Station and DX-spot markers label activity across the band.
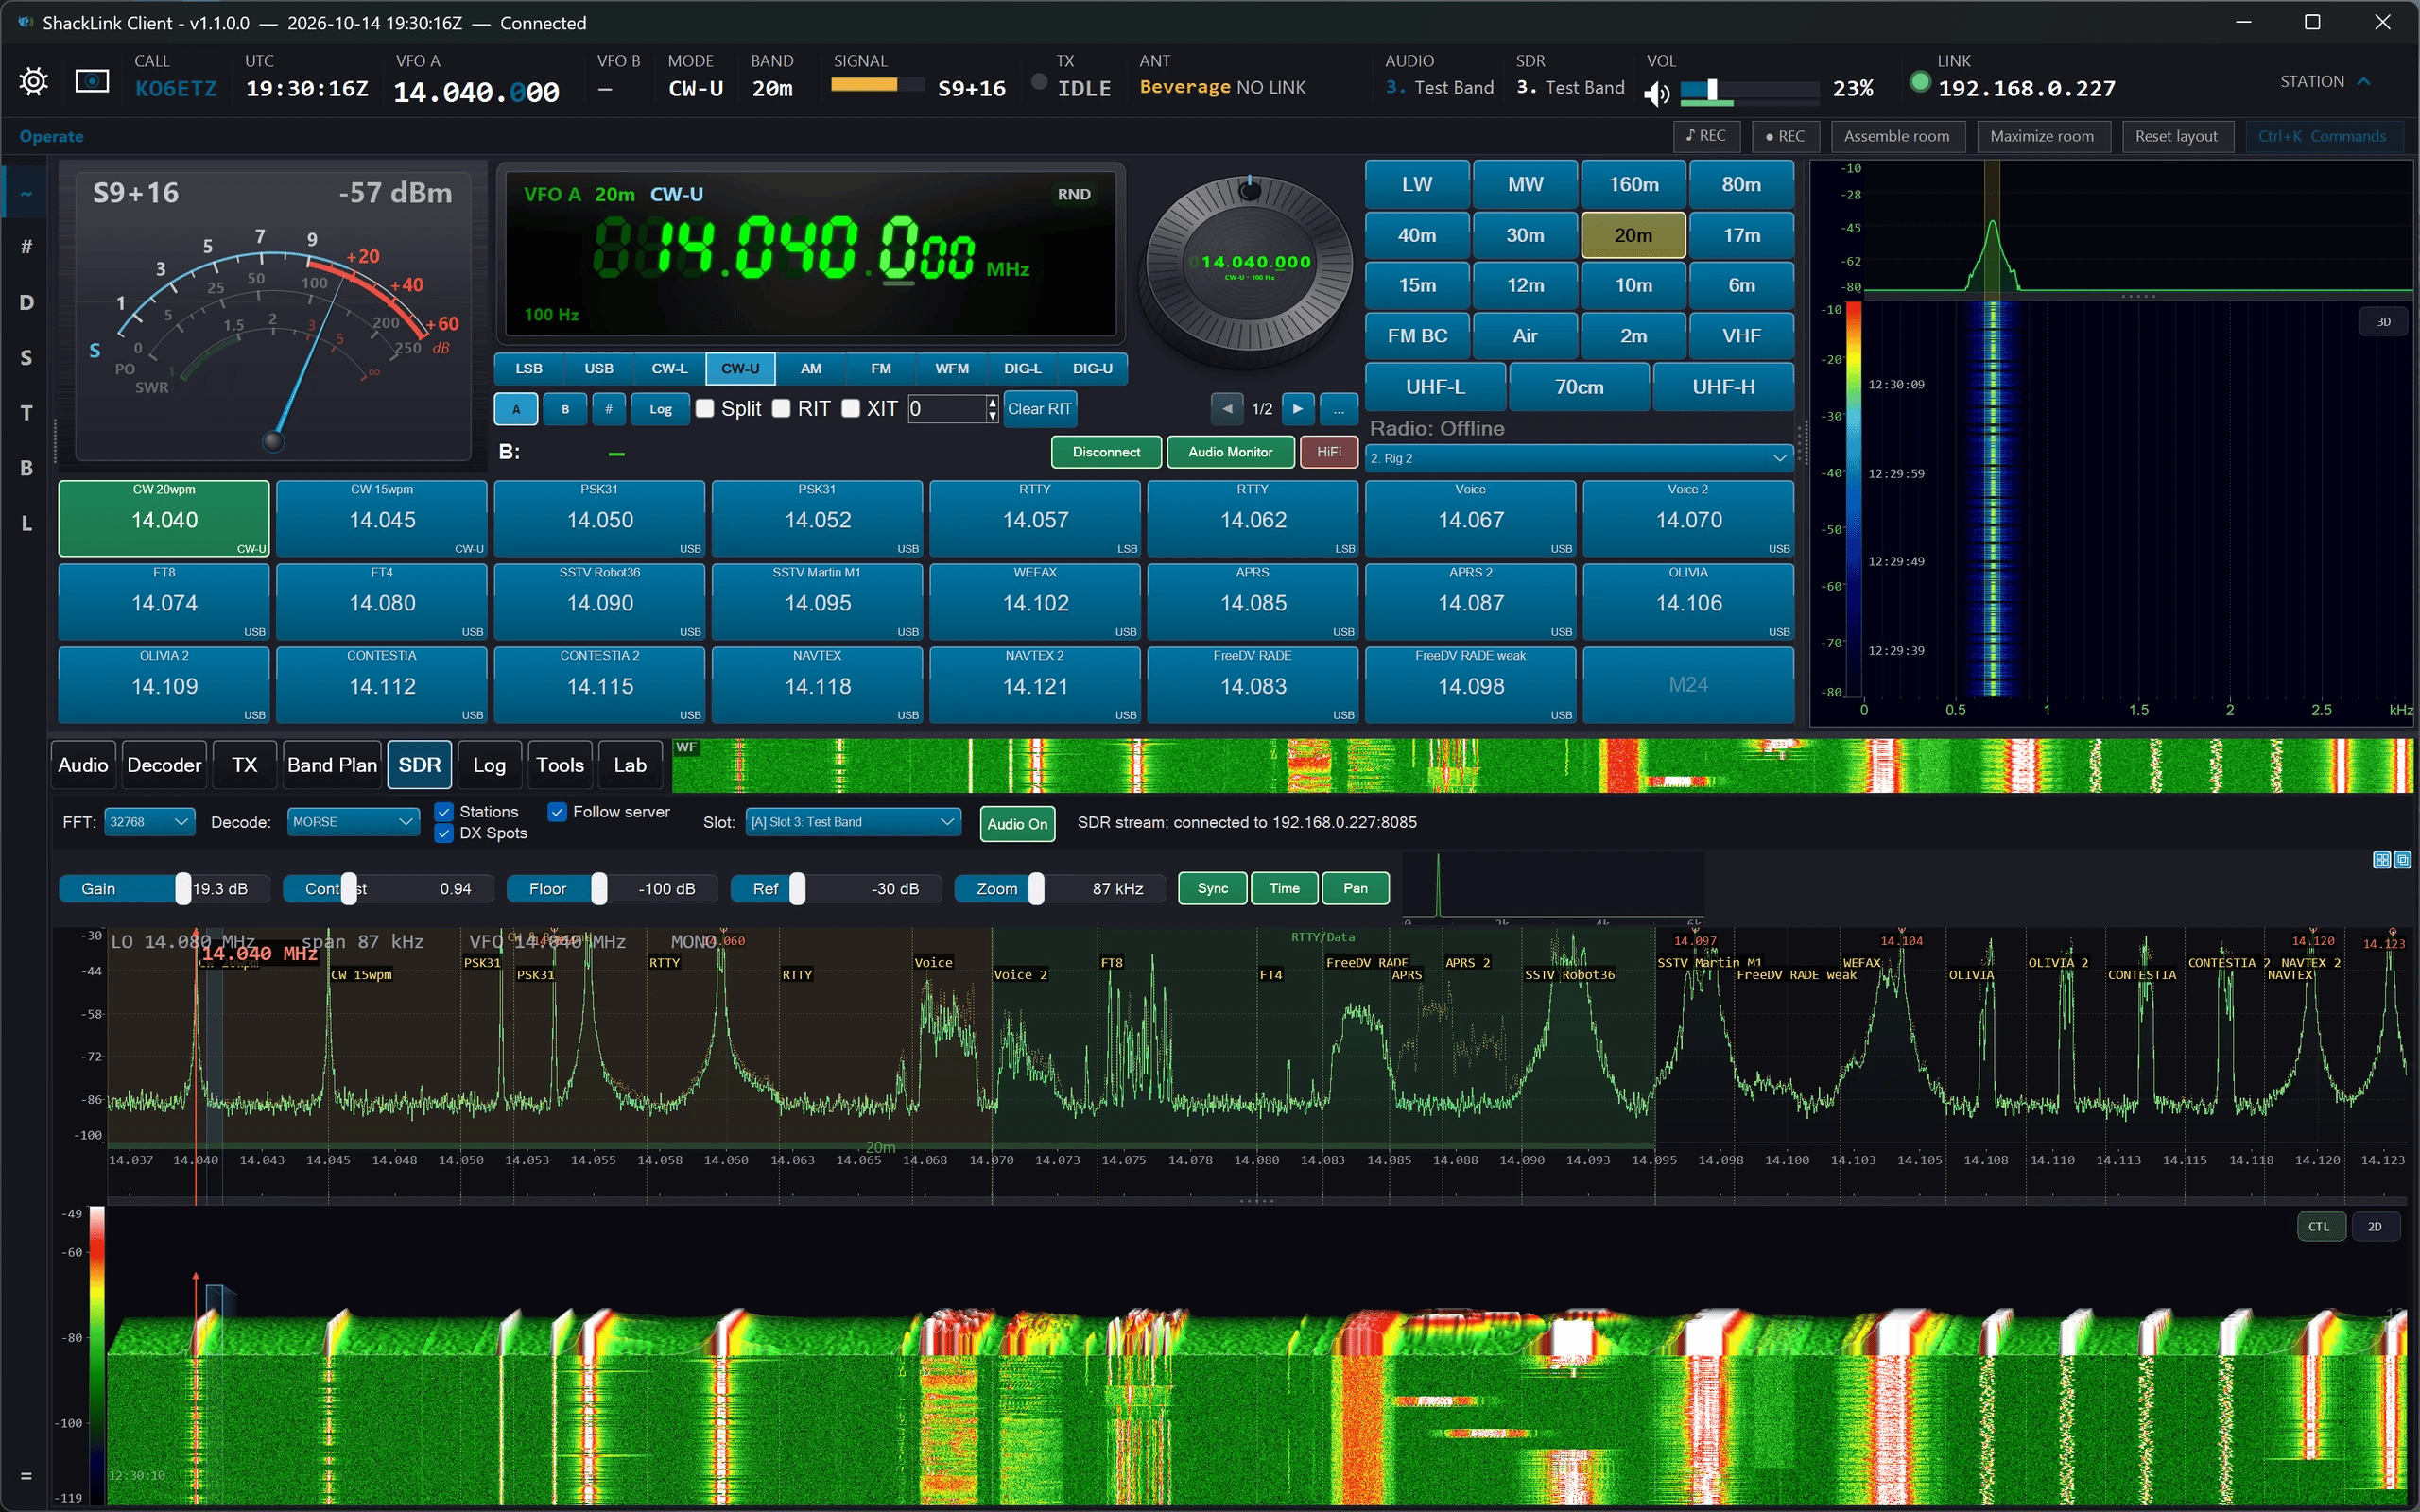
The panadapter waterfall toggled to the 3D perspective terrain view.
Antenna Switching
New in 2026-08. If the server owns your station’s antenna switch, the client can pick the antenna for the operating rig and tell you whether the path the server would transmit into is confirmed. It decides nothing: the catalogue, the band coverage, the per-band memories, the drivers and the transmit interlock all live on the server.
- The
ANTcell on the flight strip — click it for a menu of the antennas wired to this rig’s port. The current one is ticked, receive-only ones are marked(RX only), and ones that do not cover the band you are on are greyed. The menu also carries Follow / Manual and Swap. - …and that is the only one. The faceplate carried a duplicate row until 2026-08-24; it was retired, because it was a second control for a value the strip cell already owns and cannot fold away. The picker is a panel of cards — a thumbnail of each antenna’s type beside its name and its switch port. A rig reaches one switch port, so its list is short; antennas on other ports are shown greyed under their own switch’s heading rather than hidden, because naming which antennas are out of reach is what tells you the binding needs changing.
- Neither appears until the server says this rig is bound and the catalogue is non-empty. A station that has never configured a switcher gets no control, not a dead one.
The confidence beside the antenna is the reading the transmit interlock acts on: OK (the switch reported the position back), ASSUMED (written and accepted, but this hardware has no readback — its honest ceiling, and not an alarm), UNKNOWN and STALE (both of which the server refuses to transmit on). A parked antenna renders as a dash: that is a reading, not an absence.
Swap is A/B compare — back to the antenna your last manual pick moved away from. There is nothing to configure, deliberately: band-follow never becomes the partner, because otherwise “the other one” would mean whatever you were using on the previous band. Nothing is applied optimistically: the picker sends your choice and redraws only from what the server says actually landed, which is also what makes a refusal visible — the reason replaces the confidence text in the row where you made the pick.
Multiband
New in 2026-08. Every streaming SDR slot on one stitched frequency axis — a single spectrum and waterfall covering everything the station’s receivers can hear, side by side in true frequency order. Open it from the Multiband tile on the Tools tab; it is a dockable panel like any other.
- Click anywhere covered → that slot tunes and you start listening to it — your own per-client listen selection, not the server operator’s. Ctrl+click tunes the rig instead.
- Wheel steps the station; Ctrl+wheel zooms; Ctrl+Shift+wheel moves the reference level; the arrow keys step the listened station.
- A click on a frequency nothing in the fleet covers is refused with the nearest covered edge named — never a silent nothing, and never an LO command, which on the server would drag every decoder and skimmer riding that slot.
- A coverage ribbon puts the gaps the stitched axis hides back on screen in true scale, so 200 kHz of gap is distinguishable from 20 MHz of it.
- LEVELS gives every band its own Trim (amplitude offset) and Cut (floor clamp). The shared axis’s Ref and Floor are deliberately not per band — one plot, one labelled dB scale — and the RF gain column is server-only.
- Right-click carries the full display menu the Lab has, in Multiband’s own store. Markers, limit masks and dBm calibration are not offered: per-slot trims are live here, so an absolute calibrated number would be a lie, and the axis badges itself
relto say so.
A USB tuning knob
New in 2026-08. The cheap USB “volume knob” pucks — generic HID consumer-control devices — work as a native tuning knob, with no AutoHotkey script and no driver. Enable it in Station Settings → Tuning Knob. One detent is one wheel notch, and the on-screen knob turns with the physical one. Two modes: always tune the VFO, or follow the pointer, where the turn behaves exactly as a mouse wheel over whatever is under the cursor. The three extra buttons most pucks carry are each assignable (band up/down, tuning step coarser / finer / cycle) and pass straight through to Windows when unmapped; pressing the knob cycles the tuning step.
Cross-needle SWR / power meter
New in 2026-08. Beside the nine arc faces there is a cross-needle instrument — the Daiwa CN-901 layout, in all nine finishes. Two needles pivot from the bottom corners, forward power reads on one scale, reflected on the other, and SWR is read off where they cross. Four things about it are physics rather than decoration: the needles cross, so the left pivot drives the right scale; deflection follows voltage, not power, so the watt scale is square-law and bunches toward the top; a constant-SWR line is a constant deflection ratio and its locus is very slightly curved (printed dials draw straight lines and are approximate — this one plots the true curve); and a high SWR is only readable at reduced power, because past about 3:1 at full forward scale the reflected needle is on its end stop and the crossing lies. The numeric readout is computed from the values rather than read off the crossing, so it stays true, and the needle turns to the danger colour to say the picture no longer is.
Instrument Consoles
Six of the server’s instruments stream to the client as live view consoles. All are server-owned — they take exclusive control of real hardware, or of settings only the server can change — so starting and stopping stays on the machine holding the radios, but everything they produce is mirrored here in full. All of them (and the RDS chip feed) re-subscribe automatically after a reconnect, and say so if the link dies rather than presenting a frozen feed under a live badge.
- Band Skimmer — every signal of a mode across a whole band segment, decoded at once, one lane per signal, with a live callsign spot list. The console shows the same lanes (frequency, callsign, speed, SNR, country, decoded text), the same spots (double-click one to tune your rig to it, in that spot’s own mode), and amber skimmer chips on the SDR waterfall. Lane speed units follow each lane’s own mode — WPM for CW, baud for RTTY / PSK / NAVTEX, bandwidth in Hz for Olivia, and nothing at all for FT8/FT4 and voice, which have no rate to state. Since 2026-08 the server can skim several bands at once (one session per SDR slot), and the console shows them all, with the spot table leading on a Slot column. It can also skim Voice, on any of four demodulators (SSB / AM / NFM / WFM, one per session): lanes labelled
USB,LSB,AM,NFMorWFMcarrying transcribed speech, and spots from callsigns spoken in phonetics — on the estimated suppressed carrier for SSB, on the carrier for AM. WFM produces no spots at all, since broadcast stations do not send phonetic callsigns. - Band Activity — which band is open, to where, and how strongly, from all eight of the server’s activity sources (it previously drew the whole station’s night from two of them). Stacked bars or a band×time heatmap, a trend against the previous equal period, geography with distances and a bearing rose, and a station table with click-to-tune. Its coverage record is the point: a blank cell means nobody was listening there and no claim is made, a hatched cell means a receiver was listening and nothing was decoding. Two things are measured from deliberately different places — distances and bearings from your location, so your reach is your own, while “new entity” and “worked before” come from the server, because only the station holds the master log.
- Wide Scan — a sweep across a range far wider than any one SDR can see, drawn as a stitched panorama, a slow waterfall (one row per sweep) and a hits list. Zoom and pan are yours, independent of the server’s own window: wheel to zoom at the cursor, drag to pan, Ctrl+drag for a rectangle, the mouse’s back button to step back. Hover anywhere for the frequency, level and which radio measured that part of the span; click a hit to tune your rig to it. Gaps in the trace are real — a frequency that was not measured is drawn as a hole rather than interpolated across. The window deliberately shows no noise-floor overlay (that is the server’s own estimate and is not sent) and no plane selector (it displays what the server displays, labelled). Where the server has a classifier radio identifying hits, their mode labels arrive with them.
- FT8 Wideband — the server’s whole-band FT8/FT4 skim: the plan (which sub-bands are being watched, on which radio, with the planner’s own warnings) and a spot table keyed by real on-air frequency, with callsign, DXCC country, worked-before and the message. Click a spot to tune. A blank SNR is honest, not missing data — it means the radio’s gain moved under that cycle, so the decode is real but its level reference is gone.
- Slot Decoders — what every SDR slot’s own decoder is hearing, in one window: a lane per text-mode slot (name, mode, listen frequency, running transcript) and a table of FT8/FT4 records. A lane retires dimmed rather than vanishing when a decoder stops, so its transcript stays attributable. It is a monitor, not a spot instrument: no callsign extraction and no click-to-tune, because a per-slot decode is keyed by its slot rather than by an on-air frequency. To turn a decoder on, use the Decode picker on the SDR tab.
- TETRA (new 2026-10) — every server slot decoding a TETRA cell, as one band each: a lock lamp, the cell’s identity and whether it is encrypted, its four timeslots and who is talking, over a call log (one row per transmission) and a short-data log. Click a timeslot to make that slot’s voice play only that timeslot; click it again to follow the first clear call. Encrypted calls are never opened.
VFO Windows
The VFO Windows button opens a menu listing the radio plus every SDR slot; each entry toggles a standalone window with the frequency readout, a rotary tuning knob and a numeric keypad. The rig window tunes the radio’s VFO-A; a slot window tunes that slot’s listen point without re-centring the waterfall. Each window remembers its own size, position and open state, so a wall of VFOs can be left open across two monitors; a slot with no device shows dimmed digits rather than a stale frequency. New 2026-09-21: the keypad’s Hz / kHz / MHz keys enter a number in that unit — 7100 then kHz is 7.100 MHz.
Lab Measurements (RF Workstation)
The Lab tab provides a professional-grade RF measurement workstation, identical to the server’s Lab tab. All code is shared — the client receives SDR spectrum data from the server via the existing SDL1 binary stream and feeds it into the same multi-trace analysis engine.
Traces (up to 8)
Each trace binds to an SDR slot and applies independent processing:
- Trace modes — ClearWrite (live), MaxHold (peak envelope), MinHold (noise floor), Average (configurable N), RMS
- Per-trace controls — visibility, color, peak-hold color, label, source slot, gain offset (−60 to +60 dB), noise floor (−160 to −20 dB)
- Math traces — A+B and A−B operations between any two traces for comparison and delta measurements
- Source routing — each trace can be bound to a different SDR slot, enabling multi-device overlay comparisons
- No-data legend status — a checked trace whose SDR source isn’t delivering data still appears in the legend, its name dimmed with a short status word (“Not started”, “No data”, or “Unavailable”) in place of a frequency range, so you can see it’s selected but waiting on its device
Markers (up to 8)
- Normal — frequency and amplitude readout at the marker position
- Delta — frequency and amplitude difference between two markers
- Band Power — integrated power within a specified bandwidth around the marker
- Noise — noise density (dBFS/Hz) at the marker position
- Peak search — jump to the highest peak, navigate to next peak left/right, or find the minimum
- N-dB bandwidth — find the −3 dB (or configurable N) bandwidth around a peak. Dropdown selects 3/6/10/20/40/60 dB
- Click-to-place — click on the spectrum display to place the next marker at that frequency
- Clear All Markers — the spectrum right-click menu (next to “Place Marker Here”) removes every placed marker and clears the marker grid in one step
- Grid popout — a table-glyph button opens the Traces and Markers tables in their own window, mirroring the tab; both stay live
Tune From Spectrum & Band Browse
By default the Lab is a passive overlay, but enabling Tune From Spectrum (spectrum right-click menu) lets the Lab drive listening and tuning — it still never alters the SDR capture pipeline or FFT:
- Select a trace — click a trace to highlight it and switch audio-follow to that SDR slot (you now hear that device)
- Tune the listen point — click again within the selected trace’s band to tune that slot’s demodulator to the clicked frequency. This moves the listen point only — it does not re-center the SDR LO, so the trace stays put. Clicking a signal in a different stitched band tunes it and switches audio to that band’s device in one click
- Overlays — the selected trace can show a VFO frequency readout (“Show Frequency”) and a passband box (“Show Passband”)
- Peak markers — mark the top-N peaks on the selected trace; the “Peak Markers” submenu configures count (3–10), color, size (2–8 px), style (filled circle / outline / square / diamond), and optional frequency labels
- Band Browse — grab a trace line and drag horizontally, or click the plot then press Left/Right arrow keys, to shift that slot’s LO across the band (Shift = ×10 coarse, Ctrl = fine step). For the audio-active slot the absolute listen frequency is held by compensating the demod offset; audio mutes when that frequency leaves the captured span and resumes when a later shift brings it back. Refused for rig-tracking slots and IF-panadapter mode (a brief on-display “Locked” notice)
- Shift Station to Edge — from the spectrum right-click menu, park the selected trace’s tuned signal at the left or right edge of its span (the server computes the LO from the listen frequency and demod mode). Pair a “Right” on a lower trace with a “Left” on a higher one for a side-by-side stitched view of two signals
Automated Measurements
An eight-row Measurements grid (a label tab beside Markers) computes a measurement per trace every sweep, with blank-for-auto parameters and live Result/Detail columns; a quick readout also appears in the toolbar:
- Channel power — total power within a defined channel bandwidth
- Occupied bandwidth (OBW) — bandwidth containing 99% of signal power
- ACPR — adjacent channel power ratio
- SNR — signal-to-noise ratio
- Harmonics / THD — harmonic distortion analysis
- IMD / IP3 — intermodulation distortion and third-order intercept point
- CFO — carrier frequency offset vs a reference, in Hz and ppm
- Occupancy — percent of a band above the noise floor, averaged over a time window
- Duty cycle — percent of time a channel is keyed over a window
- Envelope — peak / current / floor at a frequency, held across sweeps
- ImageRej — I/Q image rejection: a signal versus its mirror across the receiver’s DC, in dBc
- NoiseRise — close-in noise floor near a strong carrier versus the far floor (reciprocal-mixing proxy)
- SpurMask — spurs as dBc below the carrier against a simplified ITU-R SM.329 mask, with a PASS/FAIL count
- Flatness — spectral flatness (Wiener entropy) over a band, with passband ripple
A Log to CSV toggle appends every enabled measurement row to %LocalAppData%\ShackLink\Lab\measurements.csv (about once per second) for trend plotting. Readings are relative (dB/dBFS/dBc/%/Hz) unless you supply a per-slot calibration (see below), in which case the absolute power readouts can show approximate dBm*.
Amplitude calibration (approximate dBm)
Consumer SDRs have no traceable power calibration, so the Lab is relative (dBFS) by default. You can assert an approximate absolute reference per SDR slot: switch the amplitude unit to dBm, then either type a per-slot offset directly or, with a marker on a known signal, type its level in the Cal drop-down and click Set from marker (offset = known dBm − marker dBFS). Absolute readouts (channel power, noise floor, envelope, marker amplitude, cursor) then show dBm* — the * marks it as user-asserted and not traceable. Relative metrics (SNR, ACPR, image rejection, flatness, …) are unaffected. The calibration is tied to the slot’s gain: any gain change (MGC / LNA / AGC, and conservatively IF gain) marks it stale and the slot reverts to dBFS until you re-set it — so a stale offset can never silently lie. Calibration applies on both the server and the (remote) desktop client; the server broadcasts a per-slot gain-change pulse so the client invalidates too.
Display Modes
- DPX persistence — temporal density display showing signal persistence over time. 13 color palettes (unified with the SDR tab): Classic (blue), Classic (green), CoolWarm, Viridis, Plasma, Inferno, Grayscale, Neon (cyan), Signal (teal), Semaphore, Rainbow, Paper (light), Blueprint (light)
- Spectrogram waterfall — time-frequency display with gain, contrast, floor, and speed controls. Synced frequency axis with the main spectrum display
- 3D waterfall (terrain view) — the spectrogram waterfall can toggle into a rotatable 3D perspective terrain using the same shared renderer as the SDR tab: orbit-drag the camera, “Reset 3D View”, optional “Fit Height to Pane”, GPU-accelerated with a CPU fallback
- Spectral CCDF — complementary cumulative distribution of spectrum-bin amplitude relative to the mean (a frequency-domain distribution and spectral peak-to-mean ratio, not time-domain PAPR / crest factor — that would need raw I/Q the Lab never receives)
- PSK constellation + EVM/MER — live I/Q scatter of recovered PSK31 symbols (2 points BPSK-31, 4 QPSK-31) with persistence, ideal-point overlay, and a genuine modulation-quality readout (Error Vector Magnitude %, Modulation Error Ratio dB). The server computes the metric and streams the symbol cloud, so the remote client sees the same scope. PSK31-only; shows “—” (never a fake 0 %) when no PSK31 signal is locked. A VSA summary adds peak EVM, a magnitude/phase-error split, residual carrier frequency error (after AFC), and I/Q offset, with a 60-second EVM trend
- Audio SINAD — true signal-to-noise-and-distortion ratio of a steady tone (CW/SSB beat-note, AM/FM tone, or test tone) in the demodulated audio of the SDR slot you are hearing. Measured from the real demod audio rather than the spectrum, computed on the server and broadcast to the client; a ratio, so no calibration needed; shows “—” honestly when no tone is present
- Navigator bar — optional Trace or Waterfall-history overview showing the zoom position within the full span
Instruments (Dedicated Measurement Windows)
The Instruments toolbar dropdown opens focused, single-purpose measurement windows that run alongside the analyzer — the same suite as the server’s Lab:
- Modulation Analyzer — an analog modulation meter for the slot you are hearing: AM depth, FM deviation (peak / RMS), carrier offset, and modulation rate on a needle face. Measured on the server from the demodulated audio and broadcast to the client; AM/FM only; honest “—” with no carrier
- Phase Noise — carrier-tracked SSB phase noise L(f) dBc/Hz vs log offset, with a decade table (10 Hz–1 MHz), integrated jitter, spur exclusion, window-skirt masking, and reference save/compare. Pure trace math, computed locally (the server broadcasts which FFT window is in use so the dBc/Hz is correct)
- Noise Figure — a guided Y-factor noise-figure wizard with a calibrated noise head: system NF (Mode A) or DUT NF + gain via Friis (Mode B), NF(f)/gain(f) curves, ENR head profiles, and gain-change voiding. Pure trace math, runs locally
- Mask Trigger — a view-only event console for the server’s frequency-mask trigger: armed masks, the event list, and the slot timeline. Arming and the black-box I/Q capture happen on the server
- 3-D Spectrogram (new 2026-10) — a block of sweeps drawn as a 3-D surface you can turn all the way round, zoom and click: a click picks a real frequency and moment and draws that sweep’s spectrum and history over the surface. Capture a few seconds or run Live from a server slot or a Lab trace (the server alone can also load a stretch of a SigMF recording)
The Zero-Span Scope and the video record button are server-only and not shown on the client (both need the server’s raw sample stream or its native capture component). Everything else in the Instruments menu works over the network.
Advanced Features
- Transfer function (S21) — two-SDR stimulus/response measurement with limit mask overlays for compliance testing
- Limit masks — regulatory and user-defined spectral masks (spurious emission, harmonic suppression, bandpass)
- Scripts in C# or Python — automate measurements, sweeps and data collection through the Lab’s measurement API, picking the language from the editor’s drop-down, with examples for each. New 2026-10: Python runs on the Python installed on your PC (numpy required). A script on the client can list the server’s slots by name, but raw I/Q reads work on the server only, because the client receives spectrum, not I/Q
- Export — CSV (all traces), Touchstone S1P/S2P, PNG screenshot, and measurement log
- Cable loss compensation — predefined cable types (RG-58, RG-174, etc.) and custom entry for length-based loss correction
Toolbar Controls
The Lab toolbar provides: Popout button, Reset Zoom, Start/End frequency entry with Auto-Range toggle, peak/min search and navigation, reference level and display range, N-dB bandwidth selector, DPX toggle, waterfall toggle with palette selector, transfer function dialog, limit masks, script editor, CSV export, screenshot, a live measurement result readout, an amplitude unit selector (dBFS / dBm), and a Cal drop-down for per-slot approximate-dBm calibration, and an Instruments dropdown that opens the dedicated measurement windows (Modulation Analyzer, Phase Noise, Noise Figure, 3-D Spectrogram, and the Mask Trigger event console). Waterfall gain/contrast/floor sliders appear when the spectrogram is visible.
Popout Window
The Popout button opens a separate resizable Lab window with its own independent MultiTraceDisplay, SpectrogramDisplay, and CcdfDisplay instances. Both the tab and the popout share the same TraceEngine and MarkerEngine — trace data and marker updates flow to both simultaneously. A Link toggle controls the relationship: when linked (the default) the popout mirrors the tab and display settings (zoom, ref level, palette, 3D camera, panes) sync bidirectionally; when unlinked the popout becomes fully independent with its own zoom, scale, palette, 3D camera, and pane layout, persisted separately. The popout window position and size are saved between sessions via PopoutSettings.
Persistence
The entire Lab session state is saved to %LocalAppData%\ShackLink\lab_session.cfg and restored on startup: all 8 trace configurations (source, mode, colors, gain, floor), all 8 marker states, display settings (frequency range, reference level, display range, DPX enabled, palette), spectrogram settings (gain, contrast, floor, speed), splitter positions, waterfall/CCDF trace indices, the amplitude unit, and per-slot calibration offsets (valid ones only — a gain-staled offset is dropped).
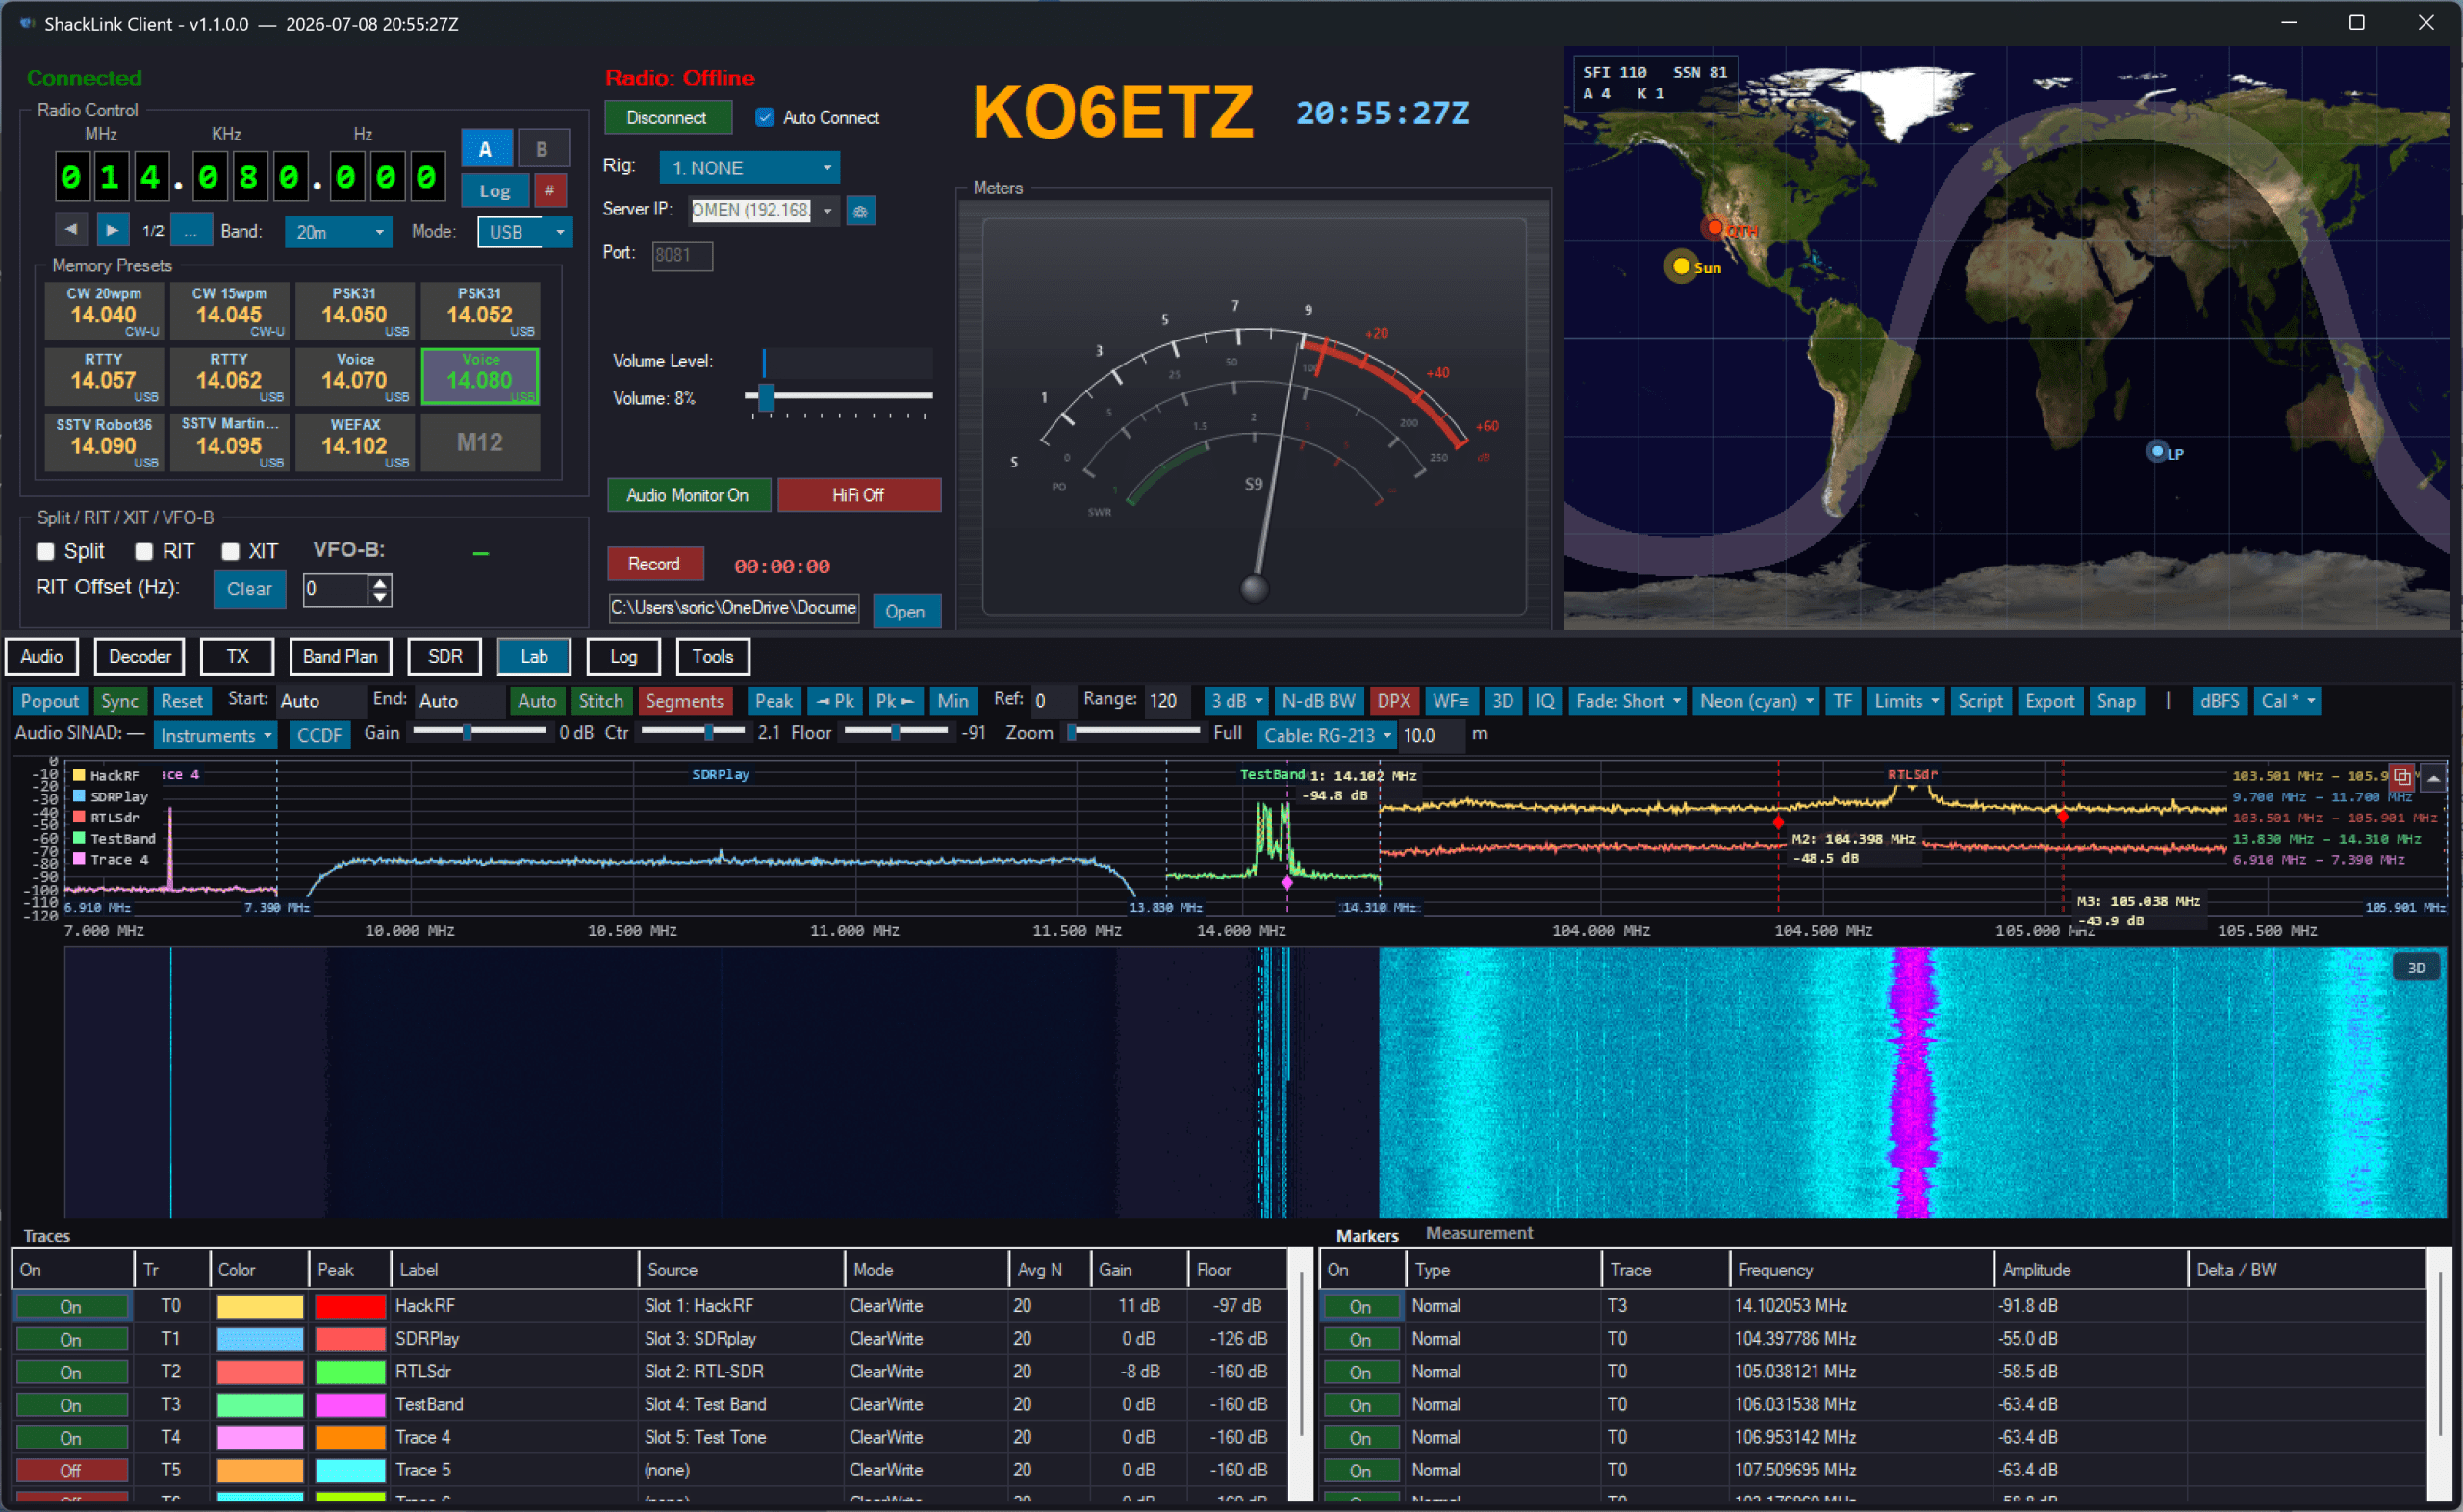
Five traces from different SDR slots (HackRF, SDRplay, RTL-SDR, and two synth sources) overlaid on a single stitched, gap-free axis spanning 7, 14, and 104 MHz, with markers and the trace / marker grids below.

The same multi-trace session with the spectrogram toggled to the 3D perspective terrain waterfall.
Connect / Disconnect
The Connect button stays enabled after connecting and changes to “Disconnect”, allowing manual disconnection from the server. Server IP and port fields lock while connected.
Band & Mode Selection
Band and mode are chosen from two segmented button strips — a vertical 19-segment band column beside the tuning block and a horizontal mode row under the readout. Selecting a band tunes to it and applies its default mode; clicking the band that is already selected is deliberately a no-op, since re-selecting it would reset the mode. The mode strip carries:
- USB – Upper Sideband
- LSB – Lower Sideband
- CW – Continuous Wave (Morse)
- FM – Frequency Modulation
- AM – Amplitude Modulation
- RTTY – Radio Teletype
- DIG – Digital modes
Digital Decoder Panel
- Decoder Mode – Select CW (Morse), RTTY, PSK31, FT8, FT4, SSTV, WEFAX, NAVTEX, APRS, WSPR, JS8, or Olivia / Contestia from the buttons. The choice is broadcast to every connected client — switching mode here switches the server tab and every other client too.
- Enable/Disable – Toggle decoding subscription
- Decoded text – Shows characters as they are decoded (CW / RTTY / PSK31 / FT8 / WSPR / JS8 / Olivia)
- Image + waterfall – SSTV / WEFAX panels show the decoded image on the left and a live waterfall of the audio band on the right with a draggable splitter. Slant / shift sliders correct alignment drift.
- Signal scope – Visual display of audio signal (CW mode)
- Clear button – Clear the decoded text display
- Save button – Save decoded text to a file (image modes save the image)
- Station speech (new 2026-10) – when the server’s operator has voice transcription on, no decoder is running and the station is in a voice mode, the tab-row strip and the photo panel’s decoder mirror show the station’s speech transcript, and its translation if the server translates. Watching changes nothing at the station
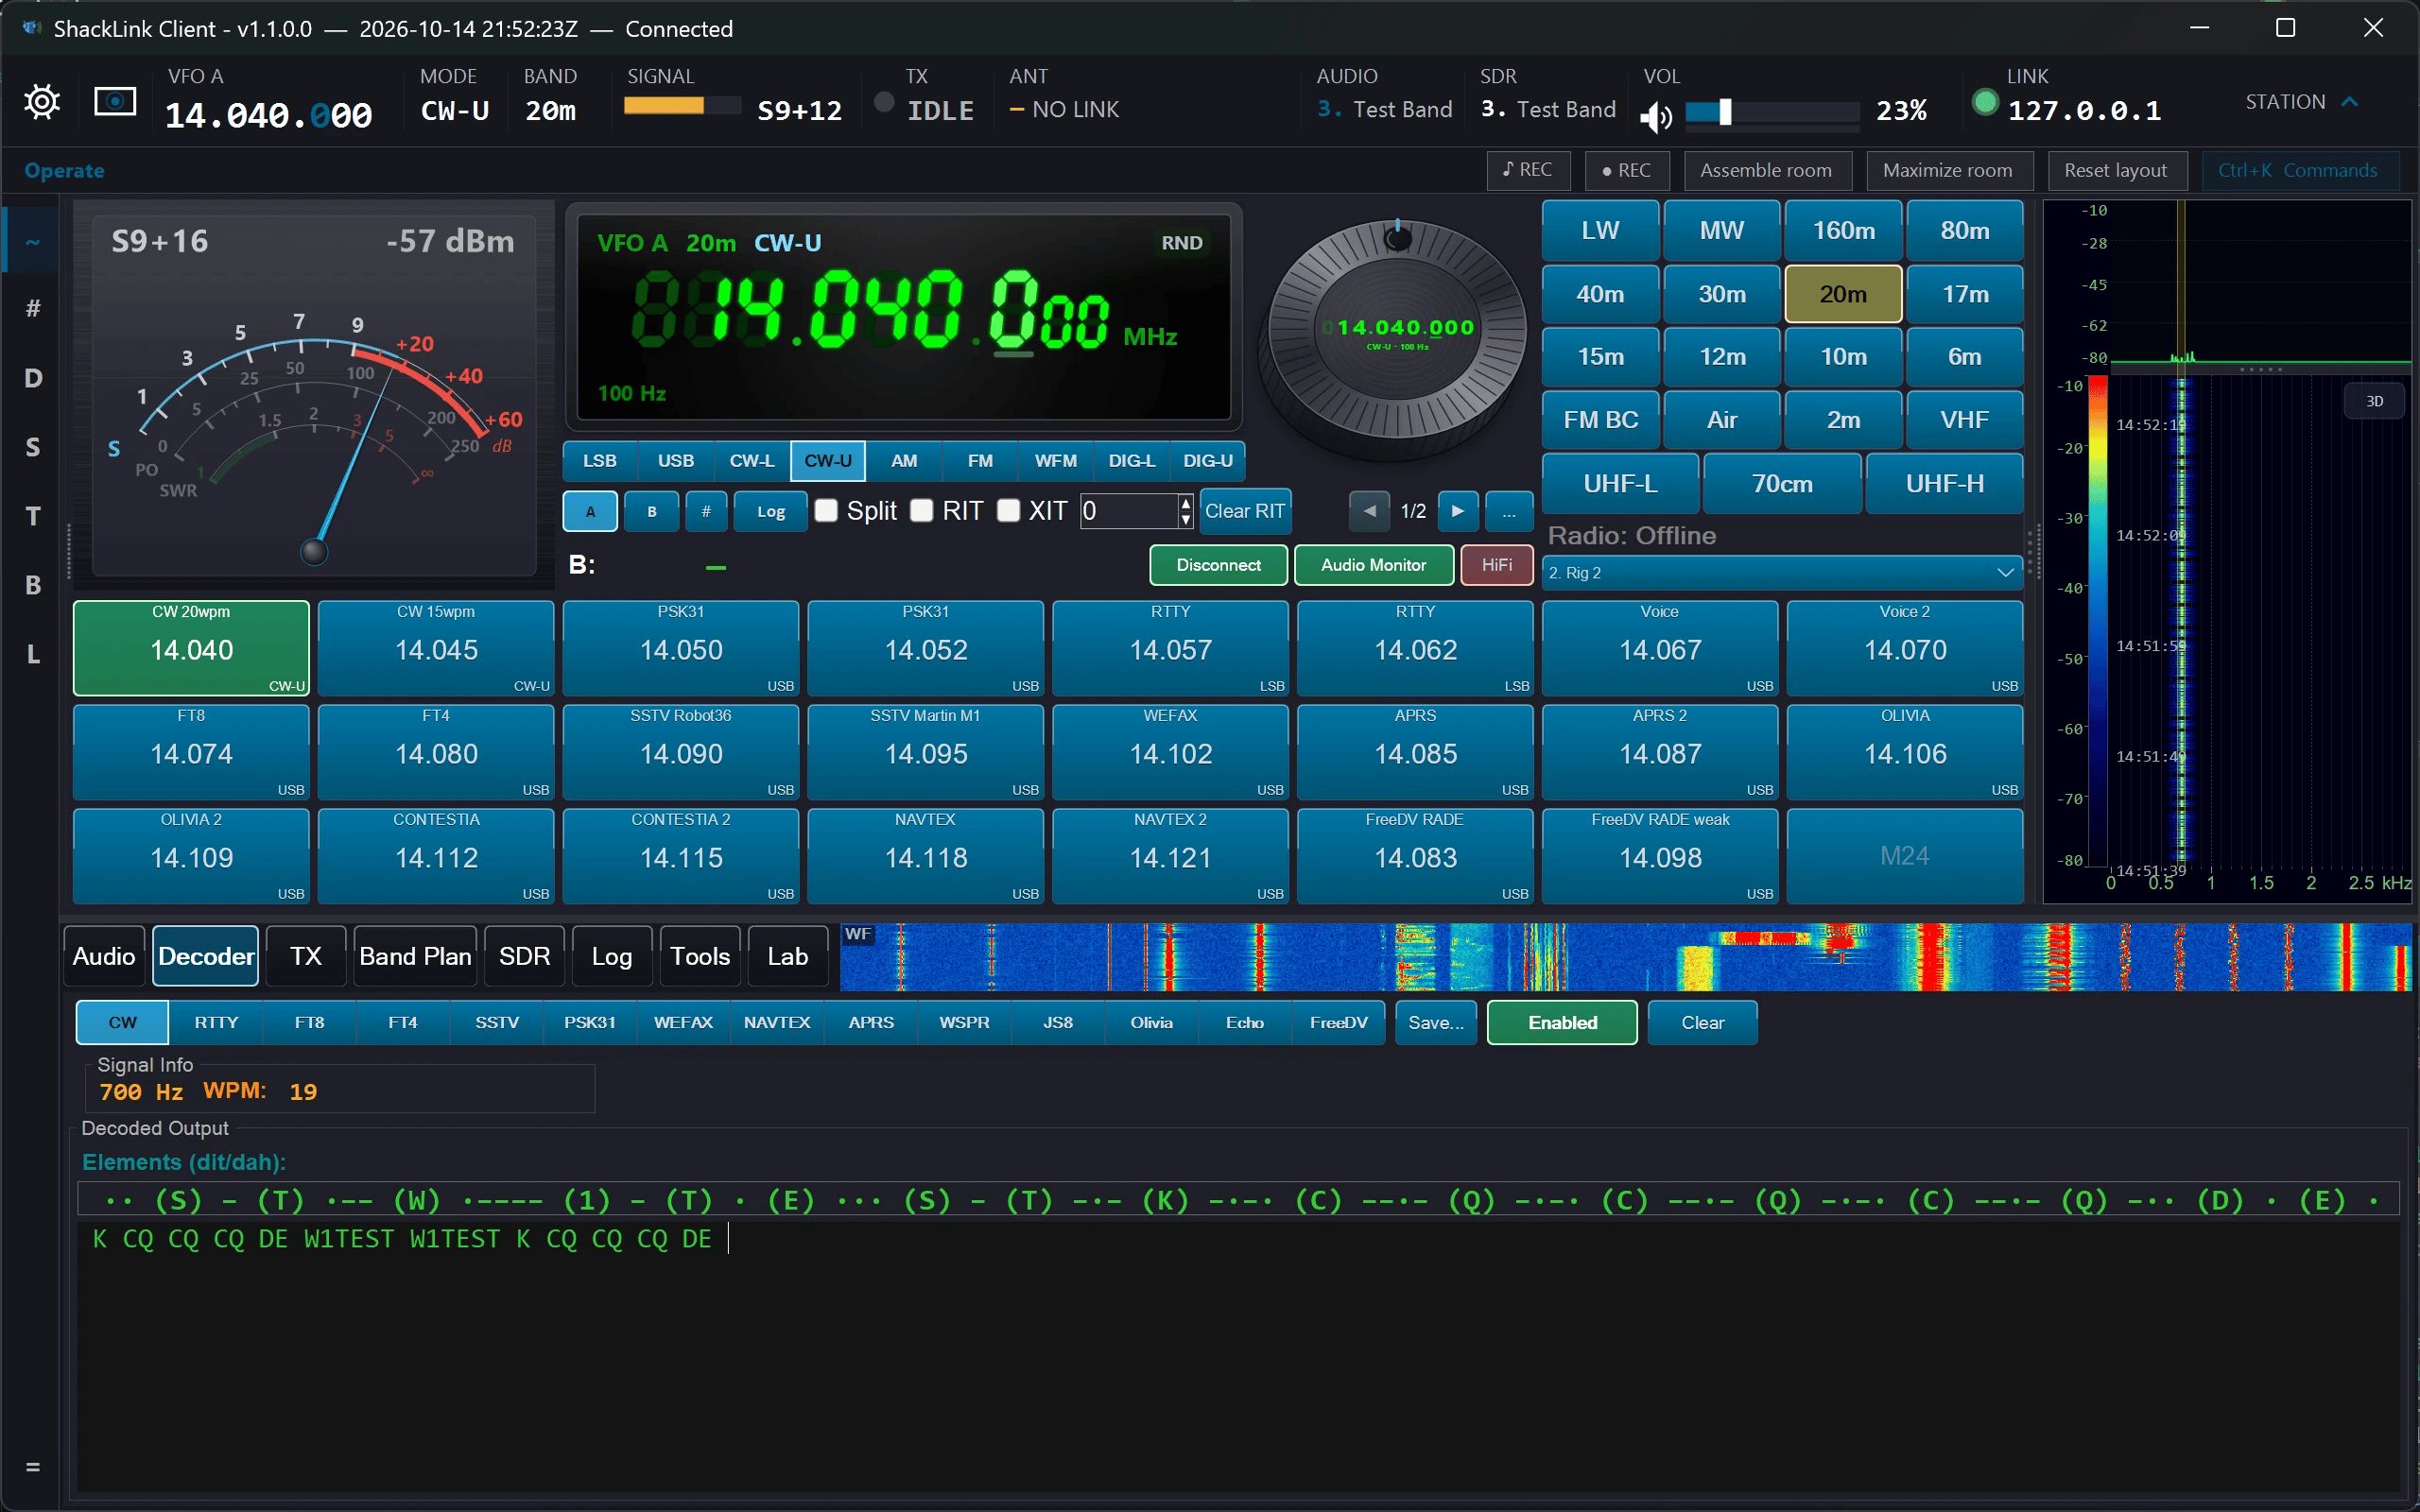
Decoder tab in Morse (CW) mode: the signal-info readout (tone frequency and WPM), the dit / dah element strip, and the live decoded text below.
TX Tab — CW, Voice & Digital
The TX tab hosts the QSO chat panel for the text and voice modes. Everything is driven through the server’s TxEngine under a single-owner lock; a Test (no RF) switch lets you rehearse offline. A power slider on the tab drives whichever output is active — rig RF % via CAT, HackRF TX VGA gain, or Hermes Lite 2 drive level.

CW: the chat timeline interleaves outgoing TX and incoming RX with timestamps, plus CQ / QSL / 73 / Log quick-send macros.

Voice: hold-to-talk PTT, a microphone device picker, and the Test (no RF) rehearsal switch, over a live audio waterfall.
TX Tab — Image Modes (SSTV / WEFAX)
When the TX-mode picker selects SSTV or WEFAX, the chat panel swaps in an ImageTxPanel:
- Pick mode (SSTV: 19 sub-modes; WEFAX: IOC + LPM)
- Choose Image — the panel resamples and shows a preview
- Click Send — image is uploaded to the server (chunked, SHA-256 verified, 5 MB cap), encoder runs, PTT keys via OmniRig, live build-up shows in the preview as the encoder transmits
- Test (no RF) mode (chat panel header): encoder runs but PTT stays low — for offline rehearsal. A WAV is saved next to the source image.
- Other connected clients see
TX:STATUSandTX:PROGRESSso they can follow the line counter

Transmitting a test pattern in Martin M1: the image preview fills in line-by-line as the encoder runs (line 98 / 256), with brightness / contrast controls. The right pane shows the outgoing signal on both the SDR spectrum and the audio waterfall.
FT8 Color Coding
FT8 messages are color-coded by signal strength (SNR) for easy identification:
| SNR Range | Color | Signal Quality |
|---|---|---|
| 0 dB and above | Bright Green | Strong signal |
| -10 to -1 dB | White | Moderate signal |
| -15 to -11 dB | Orange | Weak signal |
| Below -15 dB | Red | Very weak signal |
💡 Tip
Server-side decoding is more accurate than client-side because it processes the original audio without network jitter. CW works reliably at speeds up to 40 WPM, RTTY auto-detects baud rate and shift, PSK31 includes AFC and squelch, and FT8/FT4 decode with the server’s own engine or through WSJT-X.
📡 FT8/FT4: the server’s own decoder, or WSJT-X
The server decodes FT8 and FT4 with its own native engine, or relays them from a WSJT-X running on the server machine (UDP port 2237, with WSJT-X’s UDP Server enabled in File → Settings → Reporting). The server’s operator picks which; the decodes look the same here either way.
🔢 Native vs bridged decoders
Native — ShackLink does the DSP itself, so nothing else has to be running: CW, RTTY, PSK31, SSTV, WEFAX, NAVTEX, APRS, Olivia / Contestia, and FT8 / FT4 when the server uses its own engine.
Bridged — relayed from another program that must be running on the server machine: WSPR (WSJT-X, UDP 2237), JS8 (JS8Call, TCP API), and FT8/FT4 when the server is set to use WSJT-X. Because a bridge has no audio decoder of ours behind it, WSPR and JS8 cannot be assigned per-SDR-slot; per-slot FT8/FT4 always uses the native engine.
🔊 Olivia / Contestia
A native MFSK decoder — no external program needed. Tone sets run from 4 to 64 tones across 125–2000 Hz bandwidth (8/250, 16/500 and 32/1000 are the common on-air presets). Contestia is a family setting inside this mode, not a separate mode. Transmit is supported as well. An Auto format option detects the incoming tones/bandwidth for you in about 8–10 seconds, instead of picking them manually.
Olivia’s Squelch is a sync-confidence threshold, not an audio level. The default (3) is junk-free: it will not print garbage when the signal drops. Setting it to 1 turns it off, which buys roughly 2 dB more sensitivity but prints junk on sync loss. 10 only decodes solid signals.
📡 WSPR and JS8 bridges
WSPR — weak-signal propagation spots relayed from a co-located WSJT-X running in WSPR mode (UDP 2237, shared with FT8). Each spot is enriched server-side with DXCC country plus distance and bearing from your grid square, so no client does lookups. Spots also draw greyline paths on the map and can fire a webhook (watch-list callsigns or a new DXCC this run; off by default). The last 100 spots replay when a client subscribes. One WSJT-X instance decodes either FT8 or WSPR; a second instance (--rig-name) can run WSPR alongside FT8, and ShackLink tracks the instances separately.
JS8 — keyboard-to-keyboard JS8 traffic bridged from a running JS8Call instance over its TCP API (default 127.0.0.1:2442). JS8Call must have Settings → Reporting → TCP Server API enabled. Shows directed messages (DXCC-enriched, with the last 50 replayed on subscribe), raw band activity, spots, and the station’s identity and speed (normal / fast / turbo / slow). Messages addressed to your callsign are highlighted and can fire a webhook. Type a message and ShackLink queues it for JS8Call’s next cycle — JS8Call owns its own keying, so while it keys the rig ShackLink’s own transmit paths refuse (an advisory lock, not a hardware interlock).
Band Plan Table
Access the amateur radio band plan with frequency allocations:
- Open – Click the Band Plan button to open the frequency table
- Click to tune – Click any entry to tune the radio to that frequency
- Auto-highlight – The table automatically highlights the matching entry when the radio frequency changes
- Session persistence – Window position and open state are remembered between sessions
The band plan includes calling frequencies, band edges, and mode allocations for all amateur bands.
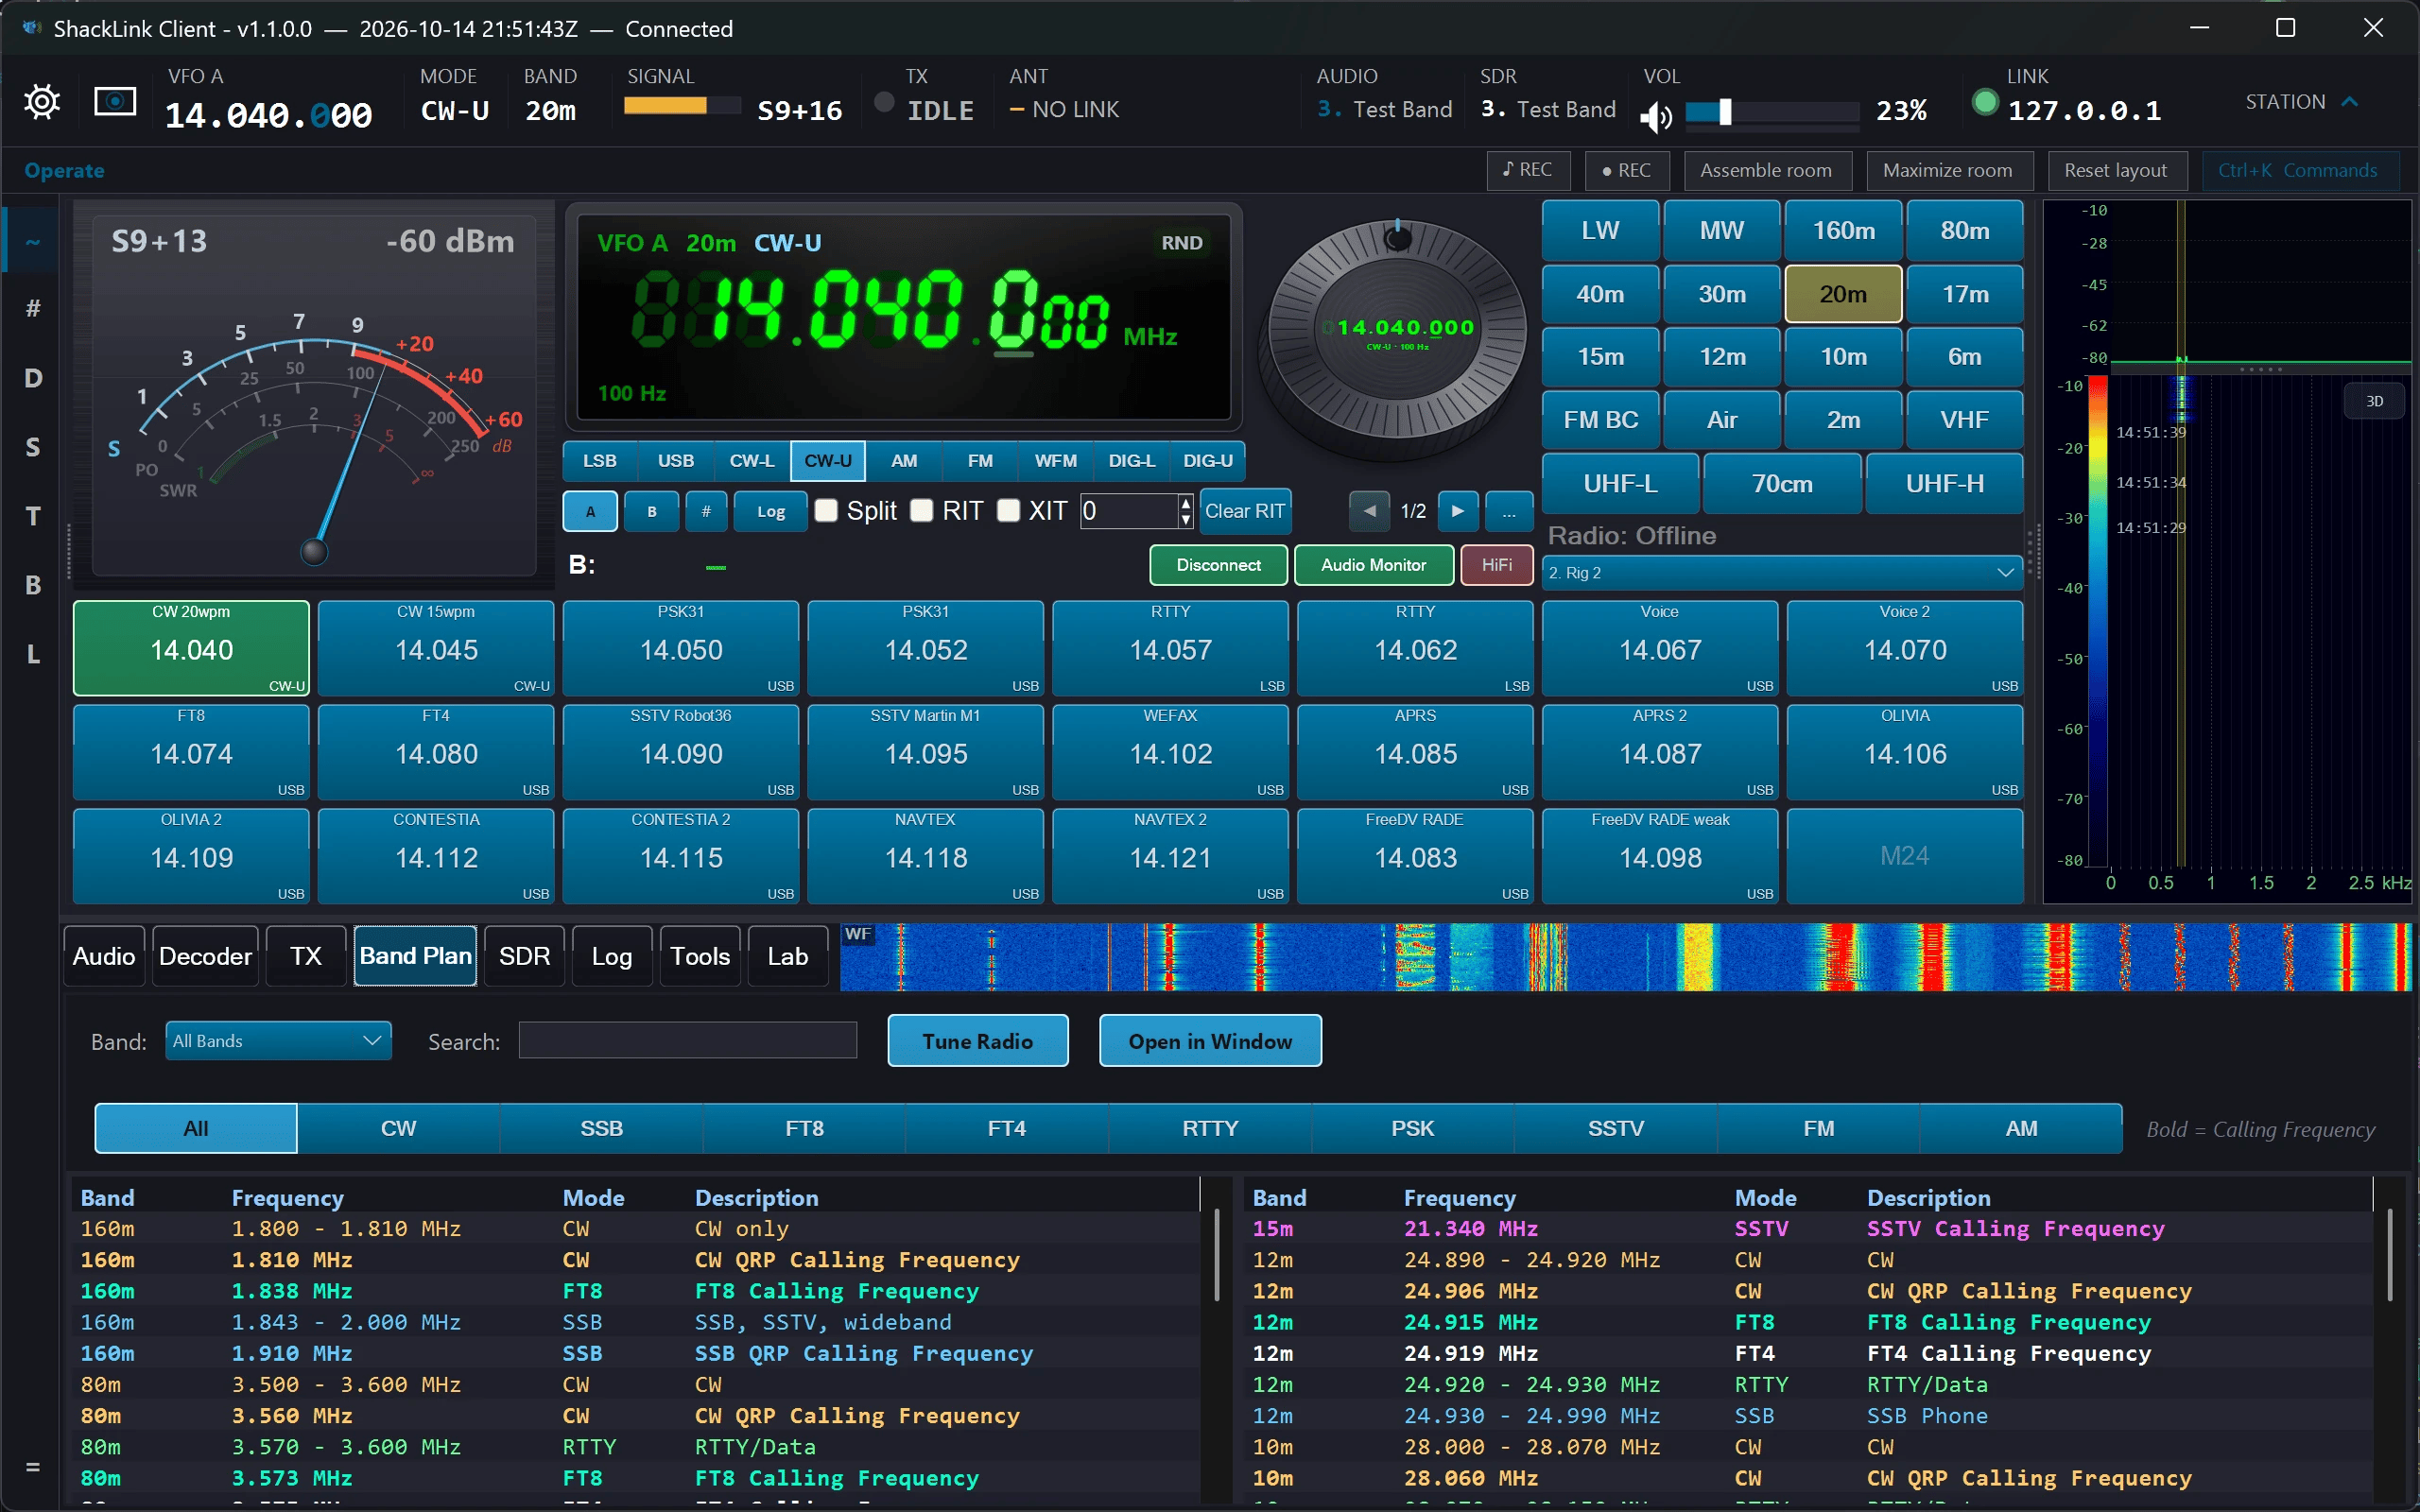
Band Plan tab: a searchable, mode-filterable allocation table (click a row to QSY, or pop it out to its own window). Top-right, the photo panel is switched to knob mode — the endless VFO tuning dial flanked by the System and App volume knobs (the shared Freq-Knob rotary controls).
🔧 Configuration
Settings Dialog
Click the gear icon next to the Server IP to access settings:
| Setting | Description |
|---|---|
| Server IP | IP address of the ShackLink Server |
| Force IP | Disable UDP auto-detection and always use specified IP |
| Callsign | Your amateur radio callsign (displayed in the application) |
Auto-Detection (Multi-Server Discovery)
By default, the client listens for UDP broadcasts from the server for automatic discovery:
- Server broadcasts its presence on port 8081 with a
name=<hostname>field so the client can display each server by name - The server dropdown populates with all discovered servers as HOSTNAME (IP)
- When multiple servers are running on the LAN, all appear in the dropdown simultaneously
- Servers that stop broadcasting are removed from the dropdown after 12 seconds
- Client automatically detects and connects when Auto Connect is enabled
- Use “Force IP” option if auto-detection doesn’t work (firewall blocking UDP)
⚠ Firewall Configuration
Ensure your firewall allows outbound connections on TCP ports 8080, 8081, 8082, 8084, and 8085 (control, audio, voice TX, HiFi MP3, SDR spectrum respectively). For auto-detection, also allow inbound UDP on port 8081, or use “Force IP” mode. From outside your home network, use the client’s WebSocket mode (see Installation above): it needs only port 8084, authenticated.
🔧 Troubleshooting
Cannot Connect to Server
- Verify the server is running and accessible
- Check the IP address and port are correct
- Ensure no firewall is blocking the connection
- Try pinging the server IP from command prompt
- If using auto-detection, try enabling “Force IP” mode
No Audio
- Ensure the Audio button shows a green checkmark (indicating streaming is active)
- Check system volume and ensure speakers are not muted
- Verify the volume slider in the client is not at zero
- Check that audio streaming is enabled on the server
- Note: Audio state is saved between sessions – if you had audio enabled last time, it will auto-start on connect
Radio Shows Offline
- Verify OmniRig is running and connected to your radio
- Check the radio is powered on and communication cable is connected
- Restart OmniRig and reconnect from the server
Application Won’t Start
- Ensure .NET Framework 4.7.2 or later is installed
- Try running as Administrator
- Check Windows Event Viewer for error details
🎨 Themes, finishes & styles
The client carries the same look system as the server — twenty-three colour themes (three of them light), fifteen button finishes, and independent dial and knob style sets.
The palette drives the whole window (readouts, meters, panels, buttons and every dropdown menu), the button finish is a separate axis from colour, and the VFO dial and the tuning knob each carry their own style set. They combine freely, so the pictures below vary one axis at a time.